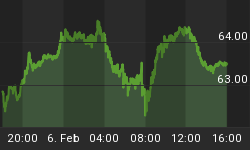
The daily chart of the Gold miners bullish percentage index (BPGDM) is shown below, with the HUI shown in green. In the past whenever the BPGDM reached 85 or higher, it was often associated with a top. At present the BPGDM has declined from 87 to 67, with an accompanying decline in the HUI. Full stochastics 1, 2 and 3 are shown below in order of descent, with the %K beneath the %D in stochastics 1 and 2. Based upon extrapolation of the trend, the potential downside could last for 3-4 weeks. Expect continued weakness in the gold stocks.
Figure 1
The daily chart of the CBOE options equity put/call ratio with the S&P 500 index shown in black. The ratio broke out of a near 3 month triangle, suggestive that further downside is likely. A full stochastic is shown below...it is important to note that for this particular chart, the %K above the %D is a sign of general weakness in the broad stock market indices, while beneath the %D is a sign of strength (all other charts having the %K above the %D is a sign of stock market strength). At present, the %K is above the %D, indicating general weakness in the broad stock market indices for at least the next 2-4 weeks.
Figure 2
The daily chart of the S&P 500 index is shown below, with upper and lower 21 and 34 MA Bollinger bands in close proximity to each other, suggestive that a breakout to the upside or downside is possible (most likely to the downside). The lower 55 MA BB curled up in late August, suggestive that a top was put in place. Full stochastics 1, 2 and 3 are shown below in order of descent, with the %K above the %D in all three instances...notice however that the %K in stochastics 2 and 3 have curled down, strongly suggestive that a top was put in place. Based upon extrapolation of the trend, expect weakness in the S&P 500 index for at least 2-4 weeks. Those wishing to go short should take precautions with tight stops. I am going to be updating the Horizon Beta funds, also looking to add an S&P equivalent long and short fund.
Figure 3
The weekly chart of the S&P 500 index is shown below, with upper 21 and 34 MA Bollinger bands above the index, suggestive that a top was put in place. Notice the lower 34 MA Bollinger band starting to curl up, suggestive that a top was put in place. Full stochastics 1, 2 and 3 are shown below in order of descent, with the %K above the %D in all three instances. Notice the %K in stochastic 1 appears to have curled over, suggestive that a top is in place or looming. The %K in stochastic 2 has yet to roll over to confirm a longer-tern downward trend but based upon Figures 2 and 3, expect weakness over the next two weeks.
Figure 4
The monthly chart of the S&P 500 index is shown below, with all three lower Bollinger bands beneath the index, suggestive the March 2009 lows will hold. Full stochastics 1, 2 and 3 are shown below in order of descent, with the %K beneath the %D in 2 and 3. Based upon extrapolation of the trend, a bottom is not likely to be put in place (double bottom or higher low) for at least 12-18 months.
Figure 5
The mid-term Elliott Wave count of the S&P 500 index is shown below, with the thought pattern forming shown in green. The S&P did not rise as expected last week, but a decline to around 900-920 should occur during the last 10 days of October. At present wave (c) is either complete or wave (d) down is underway...this structure is likely a neutral triangle that would see market support above 900 until sometime in December/early 2010. So, the trend should for the next 7-10 days should be down, followed by a brief bounce with weakness into late October.
Figure 6
The long-term Elliott Wave count of the S&P 500 index is shown below, with the thought pattern forming back in March denoted in green. The S&P went higher than initially thought, but is close to the turning point predicted. As mentioned in Figure 6, it is highly probable that weakness occurs into late October, followed by a short-term bounce into late November/early December before declining for a 4-6 month period.
Figure 7
That is all for now...I will update the Horizon Beta funds early tomorrow AM and post an update of gold in the evening. Have a great day and enjoy the last few nice days of summer??? before fall really sets in.


