


Commodities and stocks almost look ready for a rally or at least a relief bounce. The market is down over 5% and the normal pullback this year has been 4%. Using technical analysis and inter-market analysis we can see that the market is reaching extreme lows and this usually means we are only a couple days away from a rally.
I work with several market technicians as we all analyze the market a different way and share our work with each other to gain maximum insight on the broad market moves. We analyze momentum cycles, magnetic cycles, volatility levels, support & resistance levels, volume analysis and inter-market analysis.
Each of us has found a formula which works for our individual style of trading. And by combining our work we have found that we can collectively produce some very exciting trading signals for the broad market. We focus on leveraged index funds in order to take advantage of our insights. While nothing in trading is ever perfect, the analysis for timing the broad market is very exciting.
Here are some quick charts on where the market is trading.
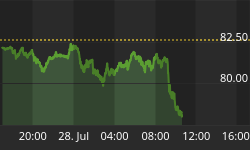
US Dollar - Daily Dollar Price Chart
This chart is a no brainer. The trend is down and trading at resistance. If the US dollar reverses back down we will see stocks and commodities move higher.

VIX - Daily Volatility Index
Again, overall the trend is down and trading at resistance. As the saying goes "When the VIX is high its time to buy". Just to be clear, the VIX is low compared to the previous highs set back in 2008 which was around the 80 level. But, if we want to keep things simple for the current trend then the VIX is high for our current market condition. The VIX moves in the opposite direction of the equities market.

DIA - Dow Jones Industrial Average ETF Fund
Here is the Dow Jones index fund and it clearly shows that when investors are selling out of their positions and getting scared of a market collapse, volume rockets higher. When we see the price pullback to possible support levels and volume increases that is a time when we should be looking to scale into a long position for a bounce, such as now.

XLE - Energy Sector ETF
You can see that the energy sector is very close to a support level and volume is high. With the US dollar about to reverse back down it will help boost this sector as it is tied in with commodity prices which rise with a falling dollar. I expect we will see a price gap lower and fill this area before moving higher.

GLD - Gold ETF Fund & Silver
This chart has not changed much from last weeks report. We are getting the drop as expected this week. We could see the gap fill from early October before gold stabilizes.
Silver is in the same situation. Gold and silver move in tandem so we are waiting for a bottom before looking for a low risk entry point.

Commodity & Stocks Trading Conclusion:
To keep things short and to the point, I am seeing momentum cycle lows as of today, magnetic wave lows today, and most commodities and indexes trading at support. These observations, coupled with the US dollar at a possible resistance level and market volatility spiking to an extreme high, lead me think a bounce is in the cards.
The market has had an amazing rally so far this year and I feel that we will have a solid year end rally going into Christmas. That being said, the recent sharp correction could form an ABC retrace pattern which means we get a bounce in the next week or so, then one more multi day sell off which will scare even more bulls out of the market. I am going to be scaling out of this oversold play quickly to lock in some gains while allowing a smaller position to ride for larger gains.
For my free trading reports visit my website: www.GoldAndOilGuy.com.


