


Rewind the movie to before the stock market lows of March 9: stocks down, corporate bonds down, commodities and gold down, emerging-market currencies down, safe havens in fashion, including the US dollar and government bonds. In short, risky assets closed sharply lower over the past few days as concerns mounted over the outlook for central bank policy and the sustainability of the global economic recovery, with investors only warming momentarily to the US emerging from recession as shown by the Q3 GDP report (announced on the 80th anniversary of Black Tuesday, October 29, 1929).
Cameron Brandt, senior analyst of fund tracker EPFR Global, said (via the Financial Times): "Good corporate earnings - viewed in recent weeks as fuel for a sustained recovery - are currently being regarded as ammunition for policymakers looking to close the fiscal and monetary stimulus taps."
Adding to the economic uncertainty, Chuck Butler of the Daily Pfennig, highlighted a study by Peter Bernholz (Professor of Economics in Basel) in which he analyzed the world's 12 most important periods of hyperinflation and discovered that the tipping point occurred when deficits amounted to 40% of the expenditures. "For the United States we have arrived at exactly that point. The deficit of $1.5 trillion amounts to 41.7% of the $3.6 trillion in expenses," said Butler.

Source: Walt Handelsman, October 30, 2009.
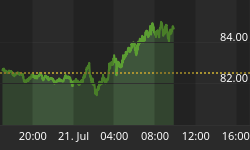
The CBOE Volatility (VIX) Index is a measure of the implied volatility of S&P 500 Index options, with very low numbers indicating extreme bullishness and very high numbers severe bearishness. It is also referred to as the "fear gauge" of US stock markets and is used as a contrary indicator as it moves inversely to equity prices. As shown below, it is noteworthy that the VIX has surged by 48.3% during the past seven trading sessions to its highest level since early July.

Source: StockCharts.com
The past week's performance of the major asset classes is summarized by the chart below. The numbers indicate an all-change pattern in the performances from the past few months as risk aversion re-entered financial markets and investors moved money from stocks and commodities into government bonds and the US dollar.

Source: StockCharts.com
A summary of the movements of major global stock markets for the past week, as well as since the October 19 peak and various other measurement periods, is given in the table below.
The MSCI World Index and the MSCI Emerging Markets Index declined by 4.1% and 5.5% respectively during the past week, resulting in the World Index being down 1.8% for the month of October and the Emerging Markets Index recording a zero return. As far as individual markets are concerned, Sweden and New Zealand were the only major markets closing the week in the black. However, a number of markets (mostly emerging) managed to see the month out with positive returns.
The US indices closed down for the second consecutive week, yo-yoing during the course of the week, but with a particularly ugly close (on steep volume) on Friday, marking the worst day in the case of the Dow Jones Industrial Index and the S&P 500 Index since the beginning of July. The benchmarks recorded their first loss-making month since February, with the exception of the Dow Jones Industrial Index that was unchanged from September.

Top performers among stock markets this week were Ecuador (+4.2%), Sweden (+1.2%), Bangladesh (+1.2%), Kenya (+1.1%) and Uganda (+1.0%). At the bottom end of the performance rankings countries included Peru (-9.5%), Ghana (-8.9%), Ireland (-8.9%), Cyprus (-7.9%) and Argentina (-7.9%).
Of the 99 stock markets I keep on my radar screen, only 15% recorded gains, 84% showed losses and 1% remained unchanged. (Click here to access a complete list of global stock market movements, as supplied by Emerginvest.)
John Nyaradi (Wall Street Sector Selector) reports that, as far as exchange-traded funds (ETFs) are concerned, the winners for the week included ProShares Short Emerging Markets (EUM) (+7.7%), ProShares Short Russell 2000 (RWM) (+6.5%) and ProShares Short Financial (SEF) (+6.5%). Besides short funds, CurrencyShares Japanese Yen Trust (FXY) (+2.3%) and PowerShares DB US Dollar Bullish (UUP) (+1.2%) also performed well.
On the losing side of the slate, ETFs included SPDR S&P Emerging Europe (GUR) (-11.0%), Market Vectors Solar Energy (KWT) (-11.0%) and Claymore/MAC Global Solar Energy (TAN) (-10.9%).
Referring to the massive Wall Street bonuses, the quote du jour this week comes from Allan Sloan in The Washington Post (hat tip: The King Report). He said: "What do the record-high Wall Street bonuses have in common with the record-low yields for savers? Answer: They show yet another way that prudent people, especially those living on fixed incomes, are being cheated by the government's bailout of the imprudent.
"Here's the deal. The government is spending trillions to keep interest rates down to support the economy and prop up housing prices, and those low rates have inflicted collateral damage on savers' incomes. 'It's a direct wealth transfer from savers and retirees to overly indebted borrowers,' says Greg McBride, senior financial analyst at Bankrate.com."
Other news is that the struggle to establish a government-backed healthcare plan in the US received new impetus on Thursday when the Democrats in the House of Representatives tabled an $894 billion bill that included a "consumer option". Separately, the Federal Deposit Insurance Corporation (FDIC) closed nine more banks on Friday, bringing the tally of US bank failures in 2009 to 115 - the first year since 1992 that more than 100 banks have gone under.
Next, a quick textual analysis of my week's reading. Although "bank" still features prominently, the key words have started taking on a more normal pattern compared with the crisis-related words that have dominated the tag cloud for many months.

The major moving-average levels for the benchmark US indices, the BRIC countries and South Africa (from where I am writing this report) are given in the table below. Most of the indices, including all the US indices, have fallen below their 50-day moving averages over the past few days, but all the indices are still holding above their respective 200-day moving averages. The 50-day lines are also above the 200-day lines in all instances.
The October lows are also given in the table. A break below these levels would indicate a reversal of the uptrend since March, i.e. reversing the progression of higher reaction lows. In fact, last week's declines resulted in some indices - including the Dow Jones Transportation Index, the Russell 2000 Index and the Nasdaq Composite Index - already having fallen below these levels.
Not shown below, the Australian All Ordinaries Index has already broken through its 200-day moving average, albeit only marginally, with the 50-day average at the same level as the 200-day level.

Below is a chart not many analysts follow, namely the Dow Jones Composite Average, made up of the 30 industrial stocks, the 20 transportation stocks and the 15 utility stocks. According to Richard Russell (Dow Theory Letters), the Composite tends to lead the market on many occasions. "Note that the Composite is trading completely below its 50-day moving average. The divergence with MACD at the bottom of the chart is spectacular. Volume is expanding as the Composite declines. In all, a nasty picture, and one that I take seriously," said the old-timer.

Source: StockCharts.com
According to Casey's Daily Dispatch, State Street Global Markets has just released its Investor Confidence Index for October 2009, measuring investor confidence on a quantitative basis by analyzing the actual buying and selling patterns of institutional investors. The results indicate that the big money is starting to turn bearish. "Global investor confidence fell by 10.0 points to 108.4 from a revised September level of 118.4. The most pronounced decline was evident among North American investors, where confidence fell by 12.8 points from 113.9 to 101.1," said the report.

Source: Cris Wood, Casey's Daily Dispatch, October 30, 2009.
Breadth indicators are useful tools to assess the inner workings of the market's rallies or corrections, and these indicators are used to identify strength or weakness behind market moves, i.e. to assess how the bulls and the bears are exerting themselves. Three of these measures are discussed below.
The advance/decline spread tracks the difference between advancing and declining issues and is widely used to measure the breadth of a stock market advance or decline. The chart below shows that the cumulative spread between declining and advancing issues on the Nasdaq turned down a few days prior to the October 19 peak and is leading the market lower.

Source: StockCharts.com
Net new highs are calculated by subtracting the number of new 52-week lows from the number of new 52-week highs. March 6 marked an "internal bottom" when a large number of the stocks on the NYSE recorded new lows (whereas a "price bottom" was recorded on March 9). Net new highs have since improved markedly, but it would seem that the ratio is close to falling below the zero line (i.e. when new lows will again exceed new highs).

Source: StockCharts.com
The number of NYSE stocks trading above their respective 50-day moving averages has dropped to 34.7% from 91.6% in September. In order to be bullish about the secondary trend, one would expect the majority of stocks to be above the 50-day line. For a primary uptrend to be intact, the bulk of the index constituents also need to trade above their 200-day averages. This is a slow indicator, with the number still at a lofty 85.9% but down from its recent peak of 93.4%.
Stock market breadth has been moving in the wrong direction over the past few days and the "internals" seem to indicate further downside.
A number of commentators have been making pronouncements about the extent of a possible decline. For example, Jeremy Grantham (GMO) expects the S&P 500 to drop by 15-25%, David Rosenberg (Gluskin Sheff & Associates) sees markets falling by 20%, Doug Kass is looking at -5% to ?12%, David Fuller at 10-15% and Barry Ritholtz at 5-15% (The Big Picture), with Andrew Smithers (Smithers & Co) the most bearish, viewing the S&P 500 to be 40% overvalued.
Turning to fundamentals: as discussed in a post a few days ago, a good way of looking at valuation levels, and cutting through the uncertainty of having to forecast earnings, is by means of Robert Shiller's cyclically adjusted price-earnings ratio (CAPE), effectively muting the impact of the business cycle by averaging ten years of earnings. Using rolling ten-year reported earnings, my research (based on Shiller's methodology, but including some refinements) shows that the "normalized" price-earnings ratio of the S&P 500 Index is currently 18.8. This compares with a long-term average of just more than 16.3 and implies an overvaluation of 13%. The graphs below show data since 1950, but the actual calculations date back to 1871.

From across the pond in London, David Fuller (Fullermoney) said: "In the short term, technical evidence suggests that we are now in a reaction and consolidation phase for most stock markets. Some of this is likely to be confined to primarily ranging patterns as we have already seen. For others, the mean reversion process towards rising 200-day moving averages is likely to include larger corrections than we have seen to date. At this stage of the stock market cycle, I regard mean reversion as a buying opportunity."
I will bide my time while the fundamentals play catch-up. Meanwhile, caution remains the operative word.
For more discussion on the economy and financial markets, see my recent posts "Stocks and risky assets stumble", "Stock markets - is uptrend still intact?", "Picture du Jour: Stock market rally long in the tooth", "Gross: Rally in risk assets at its pinnacle", "Rosenberg: Stocks overvalued by 20%" and "Jeremy Grantham: Fair value on the S&P 500 is 860". (And do make a point of listening to Donald Coxe's webcast of October 30, which can be accessed from the sidebar of the Investment Postcards site.)
For short comments - maximum 140 characters - on topical economic and market issues, web links and graphs, you can also follow me on Twitter by clicking here.
Economy
The Recession Status Map below, courtesy of Dismal Scientist Economy.com, aggregates growth statistics from around the world and allows one to see at a glance which economies are in recession, at risk or beginning to recover. Click on the map to link to the interactive version.

Source: Dismal Scientist
"There has been no meaningful change in global business confidence in almost three months. Sentiment improved sharply this summer and is now consistent with a global economic recovery, but a very tentative and fragile one," according to the results of the latest Survey of Business Confidence of the World by Moody's Economy.com. "Businesses are most upbeat about equipment and software investment and the broader outlook into early next year, and most negative about the strength of their current sales and hiring. South Americans are the most positive, and North Americans generally the most negative."

Source: Moody's Economy.com
According to Li & Fung Research Centre, the Purchasing Managers Index (PMI) in China rose to 55.2% in October, up by 1.3 percentage points from the previous month. The Index has stayed in the expansionary zone of higher than 50% for eight consecutive months, indicating that the manufacturing sector in China has continued to improve steadily.
"Several countries, such as India, Australia, Norway, and Japan, have already begun exit strategies to drain excess liquidity used to stimulate their economies to counter the global recession. India's lenders are keeping more cash in bonds and raising statutory liquidity ratios, Australia and Norway have already hiked interest rates, and Japan has said it will stop buying corporate debt by year-end," reported US Global Funds in its latest Weekly Investor Alert.
A snapshot of the week's US economic reports is provided below. (Click on the dates to see Northern Trust's assessment of the various data releases.)
Friday, October 30
Consumer spending - mild increase in Q4
Thursday, October 29
Recession is history, economy back in business
Total continuing claims are stabilizing
Wednesday, October 28
Sales of new homes decline, but inventories and prices remain favorable
Durable goods orders - mixed performance in third quarter
Tuesday, October 27
Case-Shiller Home Price Index - further improvement in home prices
Monday, October 26
Chicago National Activity Index - more validation about economic recovery
Commenting on the US GDP annual growth rate of 3.5%, John Williams (Shadow Government Statistics, courtesy of The King Report) warned that one-time stimulus or inventory items represented 92% of the reported growth.
Many people who planned to buy a car in Q4 probably took advantage of "cash for clunkers" and bought in Q3. "To put this into GDP terms, according to the Bureau of Economic Analysis (BEA) the spike you see in the chart below added 1.66% to the US GDP growth figure. Thus without it, GDP growth would have been only 1.89% (3.5-1.66%) in Q3," reported Clusterstock.

Source: Clusterstock - Business Insider, October 29, 2009.
Commenting on the US growth outlook, Asha Bangalore (Northern Trust) said: "Going forward, the lift to the headline GDP number in the third quarter is partly from future auto sales, which implies that consumer spending and GDP growth are most likely to show more muted growth in the fourth quarter of 2009 and first quarter of 2010. The Fed is on hold for several months until it is confirmed the unemployment rate has peaked."
According to MoneyNews, bond guru Bill Gross of Pimco said the Federal Reserve would not "risk raising rates" until the US has had a year-and-a-half of sustained economic growth, at a solid 4% rate.
Meanwhile, Richard Koo, chief economist at the Nomura Research Institute, warned (via MoneyNews) that the United States may go through a "lost decade" of stagnant economic growth similar to Japan's experience in the 1990s if Washington yanks stimulus money out of the economy too soon. "We still need more government spending," he said, adding that it could take "three to five years to get out of this mess, even under the best of circumstances."
Week's economic reports
Click here for the week's economy in pictures, courtesy of Jake of EconomPic Data.
| Date | Time (ET) | Statistic | For | Actual | Briefing Forecast | Market Expects | Prior |
| Oct 27 | 09:00 AM | Case-Shiller Home Price Index | Aug | -11.32% | -13.0% | -11.90% | -13.26% |
| Oct 27 | 10:00 AM | Consumer Confidence | Oct | 47.7 | 52.6 | 53.5 | 53.4 |
| Oct 28 | 08:30 AM | Durable Orders | Sep | 1.0% | 0.5% | 1.0% | -2.6% |
| Oct 28 | 08:30 AM | Durable Orders ex Transportation | Sep | 0.9% | 0.1% | 0.7% | -0.4% |
| Oct 28 | 10:00 AM | New Home Sales | Sep | 402K | 450K | 440K | 417K |
| Oct 28 | 10:30 AM | Crude Inventories | 10/23 | 0.78M | NA | NA | 1.31M |
| Oct 29 | 08:30 AM | Chain Deflator - Advance | Q3 | 0.8% | 1.3% | 1.4% | 0.0% |
| Oct 29 | 08:30 AM | GDP - Advance | Q3 | 3.5% | 2.5% | 3.2% | -0.7% |
| Oct 29 | 08:30 AM | Initial Claims | 10/24 | 530K | 520K | 525K | 531K |
| Oct 29 | 08:30 AM | Continuing Claims | 10/17 | 5797K | 5890K | 5905K | 5945K |
| Oct 30 | 08:30 AM | Personal Income | Sep | 0.0% | -0.2% | 0.0% | 0.1% |
| Oct 30 | 08:30 AM | Personal Spending | Sep | -0.5% | -0.7% | -0.5% | 1.4% |
| Oct 30 | 08:30 AM | PCE Prices | Sep | -0.5% | -0.5% | -0.5% | -0.5% |
| Oct 30 | 08:30 AM | Core PCE Prices | Sep | 0.1% | 0.1% | 0.2% | 0.1% |
| Oct 30 | 08:30 AM | Employment Cost Index | Q3 | 0.4% | 0.2% | 0.4% | 0.4% |
| Oct 30 | 09:45 AM | Chicago PMI | Oct | 54.2 | 51.0 | 49.0 | 46.1 |
| Oct 30 | 09:55 AM | Michigan Sentiment | Oct | 70.6 | 70.3 | 70.0 | 69.4 |
Click here for a summary of Wells Fargo Securities' weekly economic and financial commentary.
Next week sees interest rate announcements by the Federal Open Market Committee (FOMC) (Wednesday, November 4), the European Central Bank (ECB) (Thursday, November 5) and the Bank of England (BoE) (Thursday, November 5). In addition, US economic data reports for the week include the following:
Monday, November 2
ISM Index
• Construction spending
• Pending home sales
Tuesday, November 3
• Factory orders
• Auto sales
Wednesday, November 4
• ADP Employment Report
• ISM Services
Thursday, November 5
• Initial jobless claims
• Productivity
Friday, November 6
• Wholesale inventories
• Consumer credit
• Payrolls, etc.
Markets
The performance chart obtained from the Wall Street Journal Online shows how different global financial markets performed during the past week.

Source: Wall Street Journal Online, October 30, 2009.
"Mistakes are a fact of life. It is the response to the error that counts," said Nikki Giovanni, American poet, author and activist. Let's hope the news items and quotes from market commentators included in the "Words from the Wise" review will assist readers of Investment Postcards to formulate appropriate strategies to recover from mishaps that are bound to happen from time to time.
Wishing all my readers a Happy Halloween!
That's the way it looks from Cape Town (where the early-summer weather is unbeatable).

Source: Pat Bagley, Salt Lake Tribune
Financial Times: Transcript - George Soros interview
"Chrystia Freeland, US managing editor, interviewed George Soros about the state of the world economy, relations between the US and China, his investment performance and regulating bankers' compensation. This is a transcript of that interview.
FT: Thank you for joining us, Mr Soros.
GS: It's a pleasure.
FT: How do you judge the state of the world economy? Has the world recovered from the crisis of 2007/2008?
GS: Well, certainly the financial markets have regained their composure so they're beginning to function again, and also the world economy has overcome the shock that it has suffered because for a while everything froze and now things are moving again. So there is rebound, but I think that the facts of the crisis will take a long time for the world to absorb and the main source of the problem is in the United States. This is where consumers have spent more than they earned for a period of 25 years; where we have accumulated current account deficit that reached 6.5 per cent at its peak, which actually could have continued because there were other countries - particularly China and the Asian tigers - that were very happy to run a continuous surplus and to finance our deficit. So that could have actually continued, but the households became over-indebted and it's the consumer who accounts for over 70 per cent of the US economy that has to cut down, and that will take a while.
Then also you've got the banking system that basically was bankrupted. It's at the bottom and has to earn its way out of a hole and, again, it's happening at a pretty fast clip because banks borrow at zero and buy 10-year government bonds, yielding 3.5 per cent, and that's a pretty fast rate of earnings for no risk. So, they'll earn their way out of a hole, but it will also take time. And then there's still the whole area of commercial real estate, where the losses have not been recognised. So the source of weakness in the world will be mainly in the US consumer spending and in, let's say, the decline in the banking sector.
FT: And is that weakness in the US sufficiently grave that there could be a W-shaped recovery, that there could be another dip downwards?
GS: Well, I think certainly there could be another dip in the stock market because, right now we are enjoying the confidence multiplier and there's a sort of a hope that this is a crisis like the previous ones and we will just sort of recover in a V-shape recovery. So, when that hope is not fulfilled, I think that will be …
FT: Which you are certain it will not be fulfilled?
GS: Well, I can't see it being fulfilled. I may be wrong. I've been wrong before, but I just don't see where the growth in the US economy can come from.
FT: Given this continued weakness in the US economy, are people right to start to be concerned about the dollar?
GS: Well, they are of course and the dollar is a very weak currency except for all the others. So there is a general lack of confidence in currencies and a move away from currencies into real assets. The Chinese are continuing to run a big trade surplus and they're still accumulating assets and basically the renminbi is permanently undervalued because it's tied to the dollar. There is a diversification from assets that are normally held by central banks into other assets, especially in the area of commodities. So there is a push in gold, there's a strength in oil, and that is in a way a flight from currencies.
FT: Is there going to be a tipping point, a moment at which the dollar is fatally weakened? Or does it just sort of carry on?
GS: As long as the renminbi is tied to the dollar, I don't see how the decline in the dollar can go too far. Now, of course, to some extent it's very helpful because with the US consumers saving more and spending less, exports can be way for the US economy to be balanced. So, an orderly decline of the dollar is actually desirable."
Click here for the full interview.
Source: Financial Times, October 23, 2009.
Forbes: Roubini - are capital controls in fashion again?
"Currency appreciation in emerging markets has been particularly strong this year both because of external conditions - including high liquidity, a weak US dollar and strong risk appetite - and domestic factors such as strong fundamentals, high potential growth and wider interest rates differentials. With portfolio investments to emerging market (EM) countries also rising, policymakers need to figure out how to avoid losing international competitiveness while also containing asset inflation and the emergence of asset bubbles. So far this year, most countries have opted for or maintained either verbal intervention or reserves accumulation. Others have kept or chosen more aggressive administrative measures, including capital controls mostly targeting portfolio investments rather than FDI.
"The imposition of capital controls on capital inflows as well as currency intervention tends to be ineffective in reversing the appreciating trend of the local currencies, especially if the latter are primarily driven by external factors. However, capital controls may be helpful in easing volatility and the pace of the trend itself. The risk is that capital controls are seen as punitive measures against capital markets. They raise uncertainty about future policy actions, hurt the credibility of the central bank and increase the costs of external funding for local businesses. Overall, policymakers' actions to contain the appreciating trend of their countries' currencies depend on how fast capital is flowing in, sterilization costs, and monetary policy flexibility. Consequently, EM countries where currencies and equity markets have surged over the course of the year are the most likely to impose some sort of limitations on capital inflows.
"Capital controls alone may not be enough.
"It is important to recognize that the use of capital controls is not uniform and neither are the results. In addition, their impact can be subdued by global conditions. In today's economy, EM currencies are up against a weakening dollar. The dollar is down 6.3% YTD and 14.3% from its March peak. The EM currency rally this year is even stronger than that of the US Dollar Index, with five different currencies gaining over 10% YTD. Only the Argentine peso has posted a significant loss against the dollar YTD.
"Governments are best served implementing measures aimed at smoothing currency appreciation as opposed to halting or reversing trends. This can be done in part by identifying and targeting areas of volatility and hence vulnerability. By addressing areas of greater volatility, countries can smooth currency flows without endangering macroeconomic stability. The recent tax in Brazil targets volatile portfolio flows as opposed to FDI. Portfolio investments fled Brazil following the Lehman collapse only to flow back this year. Meanwhile, FDI has remained relatively stable.
"Given the extraordinary flow into emerging markets, it is unlikely that capital controls or intervention alone will be able to put the brakes on EM currency appreciation. Indeed, the Brazilian real gave up 3% against the dollar following the announcement of the tax before appreciating 3.7% after four days. That said, Brazil and other governments may find themselves in a position where they need to tap a greater arsenal if their desire to stem appreciation is strong. With that in mind, look for central bank intervention to be a greater theme in the coming months."
Click here for the full article.
Source: Nouriel Roubini, Forbes, October 29, 2009.
MoneyNews: Krugman - China simply stealing jobs
"China's asset-buying binge inflated the US housing sector, setting the stage for the global financial crisis, but the Chinese policy of keeping the yuan-dollar rate fixed may be causing an even more harmful economic bubble, says Nobel Prize winner Paul Krugman.
"'China has been keeping its currency pegged to the dollar - which means that a country with a huge trade surplus and a rapidly recovering economy, a country whose currency should be rising in value, is in effect engineering a large devaluation instead,' writes Krugman in The New York Times.
"China is creating a bubble for its own economy. Krugman says this policy is particularly precarious during a period when the world economy remains deeply depressed due to dampened demand.
"'By pursuing a weak-currency policy, China is siphoning some of that inadequate demand away from other nations, which is hurting growth almost everywhere,' writes Krugman.
"'The biggest victims, by the way, are probably workers in other poor countries. In normal times, I'd be among the first to reject claims that China is stealing other peoples' jobs, but right now it's the simple truth.'
"The US government has been excessively tepid in addressing this issue.
"Last week, the Treasury Department testified in a required report to Congress that China is not manipulating its currency.
"'They're kidding, right?' writes Krugman. 'The thing is, right now this caution makes little sense.'"
Source: Gene Koprowski, MoneyNews, October 28, 2009.
Financial Times: Eurozone lending to private sector declines
"The eurozone saw the first year-on-year fall in bank lending to the private sector last month, even as signs became stronger that the 16-country region's economy had returned to growth.
"September's eurozone credit numbers indicated lending had been scaled back at an unprecedented pace, strengthening the case for the European Central Bank to maintain its ultra-loose interest rate policy.
"Loans to the private sector contracted at an annual rate of 0.3%, after a 0.1% rise in August, according to the ECB. That was the first time the annual growth rate had turned negative since comparable statistics began in 1992. The euro was launched in 1999.
"Although the data showed signs of a pick-up in lending to households in September compared with August, they could fuel policymakers' fears that a weakened banking sector will fail to provide business with the credit needed to reboot the economy.
"'A lack of credit growth could certainly undermine the pace of recovery,' said Colin Ellis, European economist at Daiwa Securities SMBC Europe. Unlike the UK, the eurozone is thought by economists to have expanded in the third quarter compared with the previous three months, marking the formal end of its recession.
"'To get a fully fledged business cycle upswing emerging, you need to see credit taking off - but that normally takes one or two years,' said Julian Callow, European economist at Barclays Capital.
"But Mr Callow argued that the latest data might have been distorted downwards by banks securitising loans, which would have removed them from the ECB's statistics even though the credit was still available to the economy."
Source: Ralph Atkins, Financial Times, October 27, 2009.
MoneyNews: Koo - US risks Japan-style lost decade
"The United States may go through a 'lost decade' of stagnant economic growth similar to Japan's experience in the 1990s if Washington yanks stimulus money out of the economy too soon, says Richard Koo, chief economist at the Nomura Research Institute, the research arm of Japan's largest brokerage.
"'This isn't a cold. It's more like pneumonia,' Koo told Bloomberg News.
"'We still need more government spending,' adding it could take 'three to five years to get out of this mess, even under the best of circumstances.'
"Koo and other noted economists such as Nobel laureate Paul Krugman believe US economic recovery expected for the latter half of this year will be short-lived if the Obama administration withdraws stimulus money.
"The administration is belatedly trying to narrow a record $1.4 trillion budget deficit and thus boost the sagging dollar.
"As an example, Koo says, look to Japan, where an asset bubble burst in 1990 and left companies repaying debt instead of taking on new projects that would have refueled economic growth via continued stimulus.
"'When we see the private sector coming to borrow again, I'll be the loudest person on earth arguing for fiscal reform. That's the exit,' says Koo.
"Nevertheless, White House Officials say stimulus spending has already kick-started the economy and will do little to help out next year.
"'By mid-2010, fiscal stimulus will likely be contributing little to further growth,' says Christina Romer, the chair of President Barack Obama's Council of Economic Advisers, according to the Associated Press."
Source: Forrest Jones, MoneyNews, October 26, 2009.
Bespoke: Is the NBER gearing up for a big announcement?
"The NBER (National Bureau of Economic Research) is the organization in charge of dating recessions and expansions in the US economy, so when the official announcement is made that the most recent recession is officially over, it will come from the NBER. Interestingly, over the weekend, the organization revamped its website for the first time in several years. While companies change their websites for multiple (and often insignificant) reasons, many revamps are often timed to coincide with major events. With most investors and economists agreeing that the economy has seen its trough (probably in June or July), we wonder if the NBER's website update was put in place ahead of an announcement from them that the recession is over?"
Source: Bespoke, October 26, 2009.
Asha Bangalore (Northern Trust): Recession is history, economy back in business
"The recession is behind us. Real gross domestic product of the US economy grew at an annual rate of 3.5% in the third quarter after a 0.75 drop in the prior quarter. This is the first increase of real GDP after a string of four quarterly declines. Real GDP has declined in five out of the six quarters of the recession.

"The Business Cycle Dating Committee of the National Bureau of Economic Research will make the official announcement after it confirms the turning point based on revisions of economic data. This recession is the longest on record in the post-war period and the deepest also. Real GDP has declined 3.8% from the peak in the second quarter of 2008 to the trough in the second quarter of 2009. This is the largest peak-to-trough decline of real GDP in the post-war period

"In the third quarter, consumer spending accounted for the largest part of the growth in real GDP, followed by exports, inventories and residential investment expenditures. Of these four components, exports and inventories are most likely to continue to make large contributions in the quarters ahead. Consumer spending is projected to advance in the quarters ahead but at a noticeably slower pace. The surge in auto sales from the 'cash for clunkers' program in the third quarter provided the temporary lift to consumer spending.
"Going forward, the lift to the headline GDP number in the third quarter is partly from future auto sales, which implies that consumer spending and GDP growth are most likely to show more muted growth in the fourth quarter of 2009 and first quarter of 2010. The Fed is hold for several months until it is confirmed the unemployment rate has peaked."
Source: Asha Bangalore, Northern Trust - Daily Global Commentary, October 29, 2009.
Financial Times: US economy grows
"US GDP figures raise a number of important questions, says Martin Wolf, chief economics commentator of the Financial Times."
Click here or on the image below to view the video clip.

Click here for the full article.
Source: Financial Times, October 29, 2009.
Asha Bangalore (Northern Trust): Consumer spending - mild increase in Q4
"The impact of the American Recovery and Reinvestment Act (ARRA) is visible in the third quarter GDP report and the President's Council of Economic Advisers has estimated that the ARRA contributed between 3 and 4 percentage points to real GDP growth in the third quarter. The 'Cash for Clunkers' program was not part of the original ARRA but was included by a supplemental bill and funds were reallocated. The purchase of cars under this program accounted for the sharp increase in auto sales in July and August and the absence of this program following its expiration in August led to the 0.5% drop in consumer spending in September (-0.6% in inflation adjusted terms).

"Effectively, expenditures on cars accounted for a large part of the strong increase in real consumer spending in the third quarter. The question now is if the absence of rebates for cars will prevent an increase in overall consumer spending in the fourth quarter. The nature of consumer spending data for the last month of quarter helps to confirm or revise forecasts of the following quarter. However, the September estimate of real consumer spending ($9261.1 billion) is barely different from the third quarter average ($9265.2 billion). Based on the small negative bias and possibility of revisions, consumer spending is likely to show only a moderate increase in the fourth quarter of 2009 after a 3.4% jump in third quarter."
Source: Asha Bangalore, Northern Trust - Daily Global Commentary, October 30, 2009.
MoneyNews: Bill Gross - no Fed hikes for a while
"Bond guru Bill Gross of Pimco says that the Federal Reserve will not 'risk raising rates' until the US has had a year-and-a-half of sustained economic growth, at a solid, 4% rate.
"Consider this in light of the fact that he and his colleagues at the money management giant have long said that US growth is about to engage in a long period of a 'new normal' where growth rates are much lower, perhaps under 2%.
"'Nominal GDP must show realistic signs of stabilizing near 4% before the Fed would be willing to risk raising rates. The current embedded cost of US debt markets is close to 6% and nominal GDP must grow within reach of that level if policymakers are to avoid continuing debt deflation in corporate and household balance sheets,' writes Gross in his monthly economic forecast.
"The US economy will likely approach 4% nominal growth as early as 2009's final quarter, says Gross. But, the ability to sustain those levels once inventory rebalancing and fiscal pump-priming effects wear off is 'debatable', he says.
"'The Fed will likely require 12 to 18 months of 4% plus nominal growth before abandoning the zero percent benchmark,' writes Gross.
The "negative wealth effect" caused by last year's stock market crash must be ameliorated to reintegrate the private sector into the Wall Street economy, the investment guru adds."
Source: Gene Koprowski, MoneyNews, October 29, 2009.
Asha Bangalore (Northern Trust): Chicago National Activity Index - more validation about economic recovery
"The Chicago Fed National Activity Index (CFNAI) slipped slightly in September to -0.81 from a revised -0.65 reading in August. However, the 3-month moving average improved to -0.63 in September from -0.96 in the prior month. According to the Chicago Fed, 'when the 3-month moving average of the CFNAI moves below -0.70 following a period of expansion, there is an increasing likelihood that a recession has begun'. The September reading of -0.63 is confirmation that the weak economic conditions are behind us. This report confirms the message from the latest Index of Leading Economic Indicators."

Source: Asha Bangalore, Northern Trust - Daily Global Commentary, October 26, 2009.


