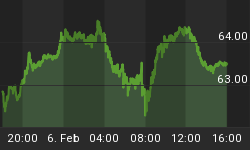
Another fantastic week for precious metals as the US dollar continues its slide lower. Energy commodities like oil and natural gas are having some difficulty finding buyers.
When commodities start to trend they become very profitable for those riding them up or down. But when a short term trend starts to virtually go straight up (parabolic) then we must be prepared for a sharp pullback. Once the price starts to slide I figure a lot of short term traders will begin locking in profits, sending gold down.
I've recently discovered the Money Flows table from The Wall Street Journal and I gotta say it's awesome. My thanks to John Townsend for bringing this resource as well as hidden gem play - DFSH - to my attention.
The Money Flow table calculates whether money is moving in or out of a stock or ETF on a given day, and whether it is selling on strength or buying on weakness. It also tells you if there are more up or down ticks. Really powerful stuff in my opinion.
For example, the GLD gold fund continued its move higher today as it must follow the underlying commodity. And though the fund traded higher institutions were selling their positions in masse. For every 9 block trades bought there were 100 block trades on the sell side. This is strong evidence that institutions/large traders are moving out of GLD. Indeed, over $161 million dollars moved out of GLD today alone and a total of $251 million dollars in the two days preceding today.
The SPY fund was 12 buy orders for every 100 sell orders. Today alone over $675 million was flowing out of SPY which his CRAZY huge. Check out the table: http://online.wsj.com/mdc/public/page/2_3022-mflppg-moneyflow-20091125.html?mod=mdc_pastcalendar
GLD ETF Trading - Weekly & Daily Trading Charts
Gold continues to claw its way higher as trader's trip over each other trying to buy this shiny investment. The weekly chart clearly shows a parabolic spike. Vertical spikes like this do not last for long, but the largest percentage of the move will be made riding this trend up with a tight stop.

SLV ETF Trading - Weekly & Daily Trading Charts
Silver is still trending up but lagging its big sister (yellow gold). The daily chart shows a nice mini bull flag and we could get an upside pop soon.

USO Fund Trading - Weekly & Daily Charts to Trade
Crude oil just does not have people participating. The dollar is dropping yet oil continues to be dormant. It has provided several intraday plays as it trades the top and bottom of the trend channel.

UNG Fund Trading - Trade the Weekly & Daily Charts
Natural gas really came to life today. It looks like people started to cover their shorts and it just kept running up for the entire session. I mentioned in a previous report that the $9 level could be a bottom and today's reversal sure makes it look good to the eye. But if this is a short coving rally, prices are still headed lower yet.

ETF Trader Conclusion:
Gold continues its incredible rally and we love every minute of it. I keep moving our stops to lock in maximum gains while providing enough wiggle room for more growth.
Silver and precious metals stocks are lagging and that is a concern. The charts look solid but I think investors are not currently willing to pay higher prices for riskier plays which include silver and precious metal stocks.
Crude oil is just drifting lower in a controlled manner. The chart looks bullish but buyers just are not in a panic to buy it right now.
Natural Gas has put in a nice bounce this week. I expect a lot of this is short covering and it could rally to the $10.50 - $11.00 area if all goes well.
The broad market is starting to look and feel over bought. We could see the market continue higher Friday because of the holiday light trading volume which virtually always moves the markets, or whatever investment is HOT, higher. This is because the large traders take time off so there are not a lot of large sellers in the market. But be ready for next week because these nice lofty prices could start tumbling down.
Get my Economic Trading Indicator Tool and my Free Weekly Trading Reports: www.GoldAndOilGuy.com
I just want to wish you a great holiday!


