• 1,050 days Will The ECB Continue To Hike Rates?
  • 1,050 days Forbes: Aramco Remains Largest Company In The Middle East
  • 1,052 days Caltech Scientists Succesfully Beam Back Solar Power From Space
  • 1,452 days Could Crypto Overtake Traditional Investment?
  • 1,457 days Americans Still Quitting Jobs At Record Pace
  • 1,459 days FinTech Startups Tapping VC Money for ‘Immigrant Banking’
  • 1,462 days Is The Dollar Too Strong?
  • 1,462 days Big Tech Disappoints Investors on Earnings Calls
  • 1,463 days Fear And Celebration On Twitter as Musk Takes The Reins
  • 1,465 days China Is Quietly Trying To Distance Itself From Russia
  • 1,465 days Tech and Internet Giants’ Earnings In Focus After Netflix’s Stinker
  • 1,469 days Crypto Investors Won Big In 2021
  • 1,469 days The ‘Metaverse’ Economy Could be Worth $13 Trillion By 2030
  • 1,470 days Food Prices Are Skyrocketing As Putin’s War Persists
  • 1,472 days Pentagon Resignations Illustrate Our ‘Commercial’ Defense Dilemma
  • 1,473 days US Banks Shrug off Nearly $15 Billion In Russian Write-Offs
  • 1,476 days Cannabis Stocks in Holding Pattern Despite Positive Momentum
  • 1,477 days Is Musk A Bastion Of Free Speech Or Will His Absolutist Stance Backfire?
  • 1,477 days Two ETFs That Could Hedge Against Extreme Market Volatility
  • 1,479 days Are NFTs About To Take Over Gaming?
How The Ultra-Wealthy Are Using Art To Dodge Taxes

How The Ultra-Wealthy Are Using Art To Dodge Taxes

More freeports open around the…

The Problem With Modern Monetary Theory

The Problem With Modern Monetary Theory

Modern monetary theory has been…

What's Behind The Global EV Sales Slowdown?

What's Behind The Global EV Sales Slowdown?

An economic slowdown in many…

  1. Home
  2. Markets
  3. Other

Do NOT Trade Against This Indicator

Increasing Product Demand, Higher Product Prices ...
Increasing Liquidity in the Market, Higher Stock Market Prices ...

Both are true if Supply remains the same or less. Some things like stock buyback programs reduce supply because shares are re-absorbed into their respective companies. We searched for on-going stock Buyback programs in effect for December and found 52.

This is not a huge number, but none-the-less, a good number. So the question is, "what is happening to Liquidity levels in the stock market?" Is Liquidity flowing in, or out?

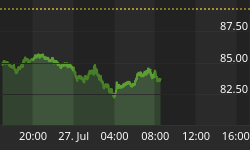
The answer is found in today's chart ... shown below.

The first two basics are: If Liquidity is in Expansion, the market goes up. If Liquidity is in Contraction, the market goes down.

The second two basics are: If Liquidity is moving up, stock prices have to increase. If Liquidity is moving down, stock prices have to decrease.

Common sense isn't it? Now, with those basics, take a look at today's chart and draw your own conclusion relative to "what Liquidity is doing in the market right now".

(Out of respect for our paid subscribers, today's chart is only shown occasionally as a courtesy to our free members. This chart is posted everyday on our paid subscriber site.)


Back to homepage

Leave a comment

Leave a comment