It's been a crazy week for stock and futures traders as the market moved up and down like a yoyo, finally closing down sharply on the week.
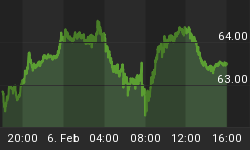
Earlier this week I posted a report showing the Volatility Index (VIX) and how it was then trading at an extreme low level which triggered the sharp market corrections. Since that post the VIX has now risen over 30% as traders start selling positions to lock in gains.
Take a quick looks at the Volatility Index chart:

Chart of S&P500 Daily Price Action
Since the low in the volatility index a few days ago we have seen the S&P500 drop over 3.4%. This sharp sell off in equities and ES futures has happened in a very short period of time making the overall market oversold when looking at short time frame of the daily chart. With the market oversold and also trading near a support level I expect we could get a weak bounce lasting 1-5 days before rolling over for another wave of selling.
There are several reasons I feel this will happen:
- Experience from seeing setups/patterns like this across many different indexes and investment vehicles leads me to believe distribution of shares are now starting to flood the market.
- The market sentiment surveys are still extremely bullish. What does this mean? Well if almost everyone is bullish, then who is left to buy?
- As the good old saying goes "Buy the Rumor, Sell the News". With earning season starting I cannot help but think everyone (smart money) will be selling into the good earnings news as dumb money buys into stocks as they meet or beat earnings. This inflow of dumb money is exactly what the big guys need to unload massive amounts of shares at a premium. Also I would like to point out that earning estimates have been very low that past year which I think has been on purpose for the institutions. This makes it very easy for companies to beat estimates each quarter giving the warm cozy feeling to retail investors (us, the small guys)
- Also Chares Biderman on Bloomberg pointed out the other day that the market looks to be manipulated by the feds as virtually all the gains have been produced after hours in the futures market.

Chares Biderman Video
The United States in my opinion is much more corrupt than most people think and I don't really want to get into this rather large and interesting debate at the moment. But Charles Biderman has some very interesting points which fall in line with my thinking about how much of what is happening is really natural and what is completely manipulated in the past 10 months of rising market prices.
Must Watch 5 Minute Video
http://www.youtube.com/watch?v=cQyFxBG6dhY
Quick Technical Chart Update on Gold
I thought this chart may be of interest to some of you as it shows two perfect textbook plays on the 4hr gold futures trading chart.
As you can see the first pattern is a reverse head & shoulders pattern. This is bullish and a breakout above the neckline would signal a buy point. Now if we use basic technical analysis with this pattern we can measure the potential move up by looking reverse head and shoulders pattern. You take the low of the upside down head $1075, and go straight up to the neckline at $1117. That is a total of $42. So if we add that $42 to the breakout point above the neckline then we can have a price target of $1117 + $42 = $1159.
As we can see the price of gold over the next couple days rallied to the $1160 level. Trading is not that easy but that is how it works in general. The hard part is knowing how to manage your trade and I scale out of positions as the price matures reaching short term resistance levels and by adjusting my stops accordingly to lock in maximum gains while minimizing downside risk.
A couple days later the same chart formed a regular Head & Shoulders and has since moved its potential measured move. I m not expecting a weak bounce in gold as with the overall stock market, but I am still not sure that the selling is over.

The "Weak'end Trading Conclusion:
In short, the market was turned upside down this week. Those who follow me should be in cash or mostly in cash as this drop was anticipated a few days ago.
Trading during fast moving markets is much tougher for swing traders as pivot points for indexes and commodities tend to happen during the intraday or during futures trading at night. High volatility like this is fantastic for active traders who focus on shorter time frames like the 4hr and 60minute charts, as opposed to trading just the daily chart and entering and exiting positions at the open and close each day.
I continue to watch the market and plan on providing some of these short term setups on the 4 hr chart using both the GLD etf gold fund and the YG Gold futures mini contract.
If you are interested in trading Gold Futures and other contracts please join my Free Futures Trading Newsletter: www.TheTechnicalTraders.com


