


Stocks and metals have been on a steady rise this week. The US Dollar drifting lower has helped to add fuel to the oversold bounce in equities and metals we are seeing.
Stocks - NYSE 65 Minute Chart
Stocks have started to show signs of a possible reversal to the upside. So far this week we have seen the major indices form a higher high and as of today are stuck under the key resistance level shown on the chart below. The rally seen this week has been on light volume indicating there is not much strength behind it at this time.
If buying volume picks up and we see the NYSE break this resistance level then money should start to pour back into the market as the first set up of higher highs and lows will have formed and that is the definition of an up trend.

Gold - 24 Hour Trading Chart Using 8 Hour Bars
This chart allows us to look far enough back to see key support and resistance levels. Today we saw gold sell down with rising volume which is bearish.

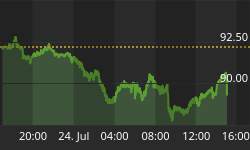
Oil - 10 Hour Candle Chart
The Oil fund is currently in the same situation as gold. It had a nice rally/bounce which was expected from the rather large sell off over the past couple weeks.

US Dollar Index - 2 Hour Chart
This chart shows the dollar rally that triggered the recent sell off in gold & silver from Jan 25th to Jan 31st. So far in February, the dollar has drifted lower into a support level and bounced sharply on Wednesday. This is very bullish price action and points to higher dollar prices in the near future.

Stock & Commodity Trading Conclusion:
In short, stocks and metals rallied on light volume which is a sign of weakness. They are both stuck under a key resistance level and selling volume has started to pickup. To add more logs to the fire, the US Dollar appears to be picking up speed for another surge higher in the next couple days.
All of this leads me to believe this weeks rally is just a dead cat bounce and lower prices are just around the corner. But, because the 60 minute intraday charts have made a higher high, the down trend is now in question. When in doubt, just stay out. During possible tops or bottoms I find it best to stay clear of the market, even for day traders unless there are very strong price and volume surges occurring.
If you would like to receive these free trading reports please visit my website: www.TheGoldAndOilGuy.com


