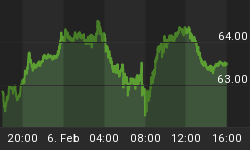
LET'S LOOK AT THE S&P 500 INDEX

Two weeks ago I laid out the time windows for this correction and the price support. One of the probabilities for "TIME" was to run down into the one year cycle around March 5th which would also be 45 calendar days from the last high. There are always counter trend rallies as a market trends down. Historically, in this circumstance a counter trend rally would be 2 to 4 trading days and up to a 3/8 retracement or 7 days and a 50% retracement---that is NORMAL. This chart is the range of the move down and shows the counter trend rally was only 2 days and 3/8 retracement. So this is "normal" for this circumstance and indicates a strong trend. I have also extended this first move down in 1/8 and 1/3 as we do with all ranges. Those extensions are the "normal" price supports for this circumstance. Two weeks ago I showed how we calculated the probable lows for this move down at 1020 to 1030 and around the level of 960 to 970 levels.
I have also taken the range down and extended it. Historically lows, in this circumstance -- (that circumstance being a rally to 3/8 in 2 trading day) is followed by an extension of the range down by ¼, 3/8 or ½. If this is a big intermediate term move down then it could extend 100% to 992, which is closer to our forecast price.
NOW LET'S LOOK AT TIME

This chart is a 90 calendar day time period which is the dominate time period for this index and divided into 1/8 and 1/3.
The TIME for a low will be around 22 calendar days from low on the 11th or 30 to 33 calendar days around the 18 to 22nd or 45 calendar days on the 5th that coincides with the one year cycle from low and is our current forecast. So as the index moves into the time windows we'll make a judgment if that could be a valid low. Our forecast calls for this move down to end at the one year cycle in the first week in March. I am also assuming that low will likely be a test of a low hit previously. In other words, the low will be tested at least once maybe twice. The rally up from the next major low will be the bull market top and could be a test of the last high. From there the index will trend down into 2012.
The concern for the debt of Greece and Portugal are not the problem, since this is to everyone's benefit to solve it, the problem will be solved. The REAL problem is the consensus that deficits must now be reined in. Remember, the reasons for this great recession are the same as the great depression -- exactly the same -- debt (leverage), greed and securitization of debt by the big banks -- same exact circumstance. The one thing that caused the depression to continue into 1942 was the attempt to rein in the deficits in 1937. And we are about to repeat the same exact stupidity. Hence the reasoning for my 5 year forecast that calls for a top in 2010 and a two year bear trend to follow -- same as 1930s and 1970s.


