• 872 days Will The ECB Continue To Hike Rates?
  • 873 days Forbes: Aramco Remains Largest Company In The Middle East
  • 874 days Caltech Scientists Succesfully Beam Back Solar Power From Space
  • 1,274 days Could Crypto Overtake Traditional Investment?
  • 1,279 days Americans Still Quitting Jobs At Record Pace
  • 1,281 days FinTech Startups Tapping VC Money for ‘Immigrant Banking’
  • 1,284 days Is The Dollar Too Strong?
  • 1,284 days Big Tech Disappoints Investors on Earnings Calls
  • 1,285 days Fear And Celebration On Twitter as Musk Takes The Reins
  • 1,287 days China Is Quietly Trying To Distance Itself From Russia
  • 1,287 days Tech and Internet Giants’ Earnings In Focus After Netflix’s Stinker
  • 1,291 days Crypto Investors Won Big In 2021
  • 1,291 days The ‘Metaverse’ Economy Could be Worth $13 Trillion By 2030
  • 1,292 days Food Prices Are Skyrocketing As Putin’s War Persists
  • 1,294 days Pentagon Resignations Illustrate Our ‘Commercial’ Defense Dilemma
  • 1,295 days US Banks Shrug off Nearly $15 Billion In Russian Write-Offs
  • 1,298 days Cannabis Stocks in Holding Pattern Despite Positive Momentum
  • 1,299 days Is Musk A Bastion Of Free Speech Or Will His Absolutist Stance Backfire?
  • 1,299 days Two ETFs That Could Hedge Against Extreme Market Volatility
  • 1,301 days Are NFTs About To Take Over Gaming?
  1. Home
  2. Markets
  3. Other

A Look At The SP 500 After A Tough Week

The S&P 500 has grown over the 60+ years since 1947 at a rate of 6.8% through the March low of 2009, the same rate of growth of the GDP over the same period. If we take for the sake of argument that the GDP is an attractor value for the price growth level of the S&P 500, then the index would be expected to end 2010 at about 1055 (11 points, or 1%, below the close last Friday).

That GDP/S&P500 assumption is perhaps a false assumption, but the correlation seems reasonable from 1947 through the mid-1980's when interest rates began to fall dramatically, followed by the dot.com bubble. By ignoring the huge rise and fall, and rise again and fall again since the mid-1990's, the March 2009 low touched the 6.8% compound growth curve shown in the graph below ...
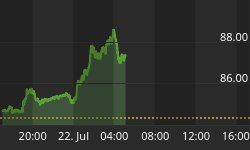
A Look At The S&P 500 After A Tough Week


Read the Report

Back to homepage

Leave a comment

Leave a comment