


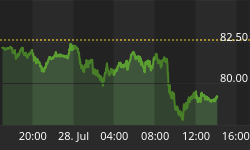


Figure 1 is a daily chart of the S&P500. The indicator in the lower panel measures the ratio of the amount of assets in the Rydex bullish and leveraged funds relative to those funds that are bearish and leveraged.
Figure 1. S&P500/ daily/ Rydex Bullish and Leveraged v. Bearish and Leveraged
The current value of the indicator stands at 1.02 suggesting that the Rydex market timers are becoming more bearish, and this is a bullish signal.
How bullish? Let's design a study with the following rules:
1) entry signal: when the ratio of the Rydex bullish and leveraged assets to the Rydex bearish and leveraged assets is less than or equal to 1 and when the S&P500 is above its 200 day moving average
2) exit signal: when the ratio of the Rydex bullish and leveraged assets to the Rydex bearish and leveraged assets is greater than 1
3) all trade signals are executed at the open of the day following the signal as this mimics exactly how I receive the Rydex data (i.e., the night before)
4) commissions and slippage are not considered.
Of note, some of the buy and sell signals are shown in figure 1.
The strategy was back tested on the S&P500 with the first trade beginning on April 15, 2003. This strategy generated 529 S&P500 points; since April 15, 2003, buy and hold has generated 170 S&P500 points. There were 35 trades, and 31 of these were profitable. This strategy had a streak of 19 consecutive winning trades. Amazingly, this strategy was only in the market 7% of the time over the past 7 years. The average winning trade lasted 6 trading days with the average loser lasting 3 trading days. There was only one outlier trade which accounted for about 10% of the profits, and the profit factor (i.e., gross profit to gross loss) was a sizzling 23 to 1.
The equity curve for the strategy is shown in figure 2.
Figure 2. Equity Curve
Figure 3 is a the maximum adverse excursion graph (MAE) for this strategy. MAE assesses each trade from the strategy and determines how much a trade had to lose in percentage terms before being closed out for a winner or loser. You put on a trade and if you are like most traders, the position will move against you. MAE measures how much you have to angst and squirm while you are in that position. Because once you close the position out for a loss or a win, you are done worrying about it. As an example, look at the caret in figure 3 with the blue box around it. This one trade lost 2% (x-axis) before being closed out as a 1% loser (y-axis). We know this was a losing trade because it is a red caret.
Figure 3. MAE Graph
Now look to the right of the blue line. There were only 3 trades that had an MAE greater than 1.6%. Or to put it another way, greater than 90% of the trades from this strategy never lost more than 1.6%.
Holy grail? Kind of sounds like it. So let's remember the following:
1) The current ratio of the Rydex bullish and leveraged to bearish and leveraged is still above 1; I have not tested for the optimal ratio to implement this strategy, but one more bearish day is likely to embolden the Rydex bears even more and push this ratio to less than 1.
2) I have selected the "best" trades by utilizing the 200 day moving average as a filter.
3) The start date of the back test coincides with the start of the 2003 bull market, when there are still many non-believers (i.e., bears). This may have skewed the results.
4) Once again, we should remember this is a very short term trading strategy and it does not say anything about the intermediate term direction of the market.
5) I always caution that what has worked in the past doesn't always work in the present. The probabilities are high that the outcome should be positive (i.e., the expectancy) but this doesn't guarantee a positive outcome. The logic (i.e., going against the consensus) behind the strategy is sound, and the logic works across multiple markets and time frames. The filter (i.e., taking only those trades above the 200 day moving average) is reasonable, and the strategy is easy to execute. These are all good features that I look for in a trading strategy.
Lastly, the current value of the ratio is 1.02; this strategy was tested using a threshold value of 1. Is there any difference between 1.02 and 1? Probably not, but I don't know. I remember 20 years ago taking my oral examinations for specialty certification in anesthesiology. The exam proctors always get to the question that requires some degree of judgment. For example, medical studies use to show that if a patient had a heart attack within 6 months of a surgery they were at high risk for having another heart attack during surgery. So the scenario always comes up: you have a patient scheduled for surgery and she tells you that she had a heart attack 5 months and 29 days ago, and the examiners want to know if you will cancel surgery. As it turns out, the correct answer isn't being dogmatic by standing behind some medical study. You could quote that famous study and you would be right, but that would always invite the examiners to say, "o.k., the patient really had a heart attack 6 months and 1 day ago.....so, now what are you going to do?" Now you have to say, "yes, I will do the case," yet nothing has really changed. As it turns out, the right answer is to say that I will assess the patient and find out what kind of heart attack she had, how she has done over the past 6 months (i.e., she could be out playing golf everyday without cardiac problems), and what type of surgery she is having (i.e., removal of a bunion under local is a lot different than an abdominal hysterectomy under general). It's o.k. to quote the medical study, but just don't become wedded to it.
1.02? 1.0? I don't have an answer for you. I have presented a study. You have to use your judgment.


