


Last week was exciting as we saw stocks and gold close above the February highs which confirms we are in a new up trend. The question everyone is wondering is:
How far will this market go before rolling over?
This is a tough question but we can get a good feeling about the risk and if it's worth putting money to work or not at this point. Here are my quick points and thoughts about the stocks indexes at the current price (March 5th closing price).
- The market is extremely overbought on the hourly and daily charts. Buying here is just chasing prices around, and that is a net losing game.
- Small Cap stocks have been on fire making a new higher for the year. This is very bullish but again buying here carries too much risk because after such a sharp price appreciation, we can see it all be given back just as quick.
- Volume over the past three weeks has been below average and when I see higher prices on declining volume I expect prices to drop very quickly once the thrust upwards ends.
Stock Market Indexes - 21 Trading Days
Here is a simple chart showing the past 21 trading sessions. It compares the Nasdaq, NYSE, Russell 2000, Dow Jones, SP500, and Amex indexes.
As you can see the Russell 2000 (small cap stocks) and Nasdaq (tech stocks) have been on fire the past couple weeks while the solid large cap stocks lag.
Are The Small Caps Stocks Telling Us Something?
Its means investors and traders are confident enough to buy higher risk companies. This is good for the overall market because small cap stocks tend to lead the market in both up and down trends. What has me concerned is the low volume rally, which I don't like.
One thing to note is that small cap stocks tend to do well during times when the US Dollar is rising. This is because they are not multinational dealing with currency exchange. So this small cap stock rally has me wondering if the US Dollar is about to continue its up trend or if investors really are comfortable with buying riskier stocks?

GLD Gold ETF - Daily Chart
Gold gained some ground last week but the majority of the money seemed to flow into small cap stocks. But take a look at this bullish chart.
This is a text book bull flag pattern complete with and ABC retrace, trend line break, and reversal candle off of a support zone. I am bullish on gold long term but think we could see prices rise a couple percent from here but will trend sideways/down for the next 2-3 weeks to digest the recent move up.

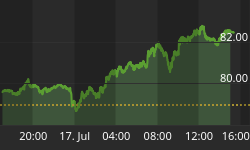
US Dollar Index - Weekly Chart
I have posted this chart several times in the past few months with 83 being a key resistance level. The dollar's recent price action is very bullish and it is flagging just under this key resistance level. I feel the price is heading lower from here but only time will tell. A breakout to the upside will put a lot of pressure stocks and precious metals.

Weekend Trading Conclusion:
Last weeks strong rally into the close will most likely carry over into Monday and possibly Tuesday. The reason being is simply because retail traders and investors (John Doe's) get excited when they see higher prices, thus it attracts more money into the market.
In short, I feel the market is overbought. All indexes are trading at resistance other than the Russell 2K index, and volume is below average. I am going to wait and see how things unfold this week before thinking about getting committed to any more long positions. If anything I will be looking to short the market using the intraday charts for a quick trade. Again low volume rallies that are overbought tend to snap back very quick on an intraday time frame providing a 1-4 hour trade.
Get My Free Weekly Trading Reports: www.GoldAndOilGuy.com.


