


In a recent blog, I suggested the markets needed to move higher into wave iii of this up leg and then back into wave iv and then another high (wave v). Since that blog a few days ago that's exactly what's happened.

I've also written recently, I expected the DOW to play catch up on the back of big cap stocks, and that's what we've seen. DOW components are breaking to recent highs, which include BA, CSCO, DD, DIS, GE, HD, INTC, JNJ, KFT, MCD, PG, UTX, and WMT. And, there are 4 others that are very close. That seems like pretty broad based component behavior driving the market.
A lot of Elliott Wave analysts have been getting this move up wrong from the perspective of trying to call a significant top leading to a big correction. In my view, there might be a couple reasons for that failure.
First, I've noticed a lot of Elliott Wave analysts are what I call a purest. They tend to only/mostly deal in price and labeling the markets they way they look, and essentially end up calling every new high as the top. What's flawed with this approach is how they consistently get it wrong. The solution is combining Elliott Wave analysis with other forms of technical analysis like Candlesticks, Bollinger Bangs, and indicators like MACD or RSI. Using a combination of tools (not just when it fits your view) provides a clearer picture of the structure and primary views of the markets, and a higher statistical probability of getting it write.
Second, many Elliott Wave analysts tend to have a certain view of the global economic (fundamental) picture, which might be absolutely correct in the longer term, but has nothing to do with the market technical's and timing markets turns (tops and bottoms). And some seem more interested in telling everyone the predicted the top, while failing to tell you they were dead wrong for months leading up to it.
Such Elliott Wave analysis, as described above, can lead to the burning of capital if followed tightly. This is why I prefer to use a more complete set of tools when viewing markets.
Below is the current market and what might be the popular Elliott Wave count by many analysts.

If that is correct, the market is done, done, or very close to done. Could this be the case? Sure. But let's wait just a minute, if this is it, we need to let price and form suggest it and confirm it and overlay other tools as well, so it's way too early. Is some form of correction due? Yes.
Below, is what I would view as the alternative count, "IF" we are still traveling up in the triple zig-zag structure.

If we're still moving higher in a triple zig-zag, then wave Z should also be an ABC pattern, and looks like we are finishing wave "a" of that "abc", and we should expect and are due for some corrective behavior, which could just be the wave "b" of the "abc" and not the start of a big sell off. Again price and form and a complete set of tools will let us know. And, there's enough wave structure into wave "a" is the end of Z, I'm just skeptical until price and form leads more clear view of that. Also, in viewing the markets as in the first chart above, we could get another wave 4 and 5 to finish this leg.
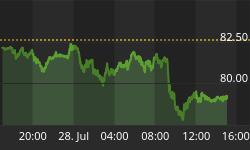
Below is my favorite chart from time to time, The Risk chart.

We've seen it moving higher in a narrowing channel. It has room to run up to 80ish before it hits the top trend line, and it's currently right at the over head resistance level. The RSI is at oversold levels. The MACD on the stock market and the Risk Chart are ready to roll over in the near future, and for me, this is what I'm watching to suggest some kind of top. This should all work itself out in the next few weeks. All are worth watching.
Hope all is well.


