


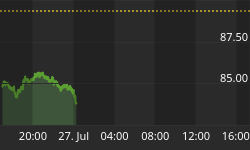


Very often when looking at sentiment indicators, many market practitioners view the data as an all or nothing phenomenon. Either we are all in or too extreme in our opinions, and it is in those extremes that market turning points occur. That is how it is supposed to work. But as we have found out in 2009 (like in 1995 and 2003), prices can continue meaningfully higher despite extreme readings in the indicators. It should be obvious that looking for extremes to call turning points in the markets doesn't work all the time.
Rather than look north south (along the y axis) for extremes, another approach is to look east west (along the x axis) at the current indicator value relative to past extreme values. To understand what I am talking about see the "Dumb Money" indicator which is shown in figure 1. As you know, the "Dumb Money" indicator looks for extremes in the data from 4 different groups of investors who historically have been wrong on the market: 1) Investor Intelligence; 2) Market Vane; 3) American Association of Individual Investors; and 4) the put call ratio.
Figure 1. "Dumb Money" Indicator/ weekly
Currently, the "Dumb Money" indicator is bullish to an extreme degree, and this implies that a price move is either nearing its end or the ascent of prices is surely to show. This is our expectation 85% of the time. This is how one would interpret the indicator when looking at it as a single point along the y-axis. We are above a certain level, so it is time for the market to reverse.
However, rather than interpret the data as a singular extreme, we can consider the current value relative to past peaks labeled 1 and 2 (along the x-axis), and we note that the indicator is lower than prior peaks. Now we can interpret this in one of two ways. One, we can say this is a good sign because the bulls have more room to run; more buyers -if there are any left - can be sucked into the market. Or two, this is a bad sign because investors aren't quite as bullish, yet prices are higher. This would be considered a divergence, and it has the potential to be significant as you don't want to see weakness in the indicators in the face of higher prices.
So what can we state about the "Dumb Money" indicator? It is extreme, yet it is not as extreme as at recent highs. In my opinion, this represents potential weakness. It is a lack of buying, but admittedly, this has yet to be confirmed by lower prices.
So the real question and one I cannot answer this week is this: Is the lack of buying due to buyers sitting on their hands waiting for a pullback that won't come or is the market running out of fresh buyers and fuel to go higher as everyone is already in? We will find out soon.
And now this from the Department of Broken Records....
The "Smart Money" indicator is shown in figure 2. The "smart money indicator is a composite of the following data: 1) public to specialist short ratio; 2) specialist short to total short ratio; 3) SP100 option traders. The Smart Money indicator is neutral/ bearish.
Figure 2. "Smart Money" Indicator/ weekly
Figure 3 is a weekly chart of the S&P500 with the InsiderScore "entire market" value in the lower panel. From the InsiderScore weekly report we get the following: transactional volume decrease as the quarter closed but insiders continue to sell with conviction and buy sporadically.
Figure 3. InsiderScore Entire Market/ weekly
Figure 4 is a weekly chart of the S&P500. The indicator in the lower panel measures all the assets in the Rydex bullish oriented equity funds divided by the sum of assets in the bullish oriented equity funds plus the assets in the bearish oriented equity funds. When the indicator is green, the value is low and there is fear in the market; this is where market bottoms are forged. When the indicator is red, there is complacency in the market. There are too many bulls and this is when market advances stall.
Figure 4. Rydex Total Bull v. Total Bear/ weekly
Currently, the value of the indicator is 66.82.41%. This is the most extreme value in 9 years. Values greater than 58% (arbitrarily chosen) are associated with market tops, and the red dots over the price bars indicate such.
Shorter term Rydex measures continue to suggest excessive bullishness. This data, which has proved to be very actionable, is now available for a nominal yearly fee as Premium Content. This service should help you to improve your market timing!


