• 322 days Will The ECB Continue To Hike Rates?
  • 323 days Forbes: Aramco Remains Largest Company In The Middle East
  • 324 days Caltech Scientists Succesfully Beam Back Solar Power From Space
  • 724 days Could Crypto Overtake Traditional Investment?
  • 729 days Americans Still Quitting Jobs At Record Pace
  • 731 days FinTech Startups Tapping VC Money for ‘Immigrant Banking’
  • 734 days Is The Dollar Too Strong?
  • 734 days Big Tech Disappoints Investors on Earnings Calls
  • 735 days Fear And Celebration On Twitter as Musk Takes The Reins
  • 737 days China Is Quietly Trying To Distance Itself From Russia
  • 737 days Tech and Internet Giants’ Earnings In Focus After Netflix’s Stinker
  • 741 days Crypto Investors Won Big In 2021
  • 741 days The ‘Metaverse’ Economy Could be Worth $13 Trillion By 2030
  • 742 days Food Prices Are Skyrocketing As Putin’s War Persists
  • 744 days Pentagon Resignations Illustrate Our ‘Commercial’ Defense Dilemma
  • 745 days US Banks Shrug off Nearly $15 Billion In Russian Write-Offs
  • 748 days Cannabis Stocks in Holding Pattern Despite Positive Momentum
  • 749 days Is Musk A Bastion Of Free Speech Or Will His Absolutist Stance Backfire?
  • 749 days Two ETFs That Could Hedge Against Extreme Market Volatility
  • 751 days Are NFTs About To Take Over Gaming?
Another Retail Giant Bites The Dust

Another Retail Giant Bites The Dust

Forever 21 filed for Chapter…

Zombie Foreclosures On The Rise In The U.S.

Zombie Foreclosures On The Rise In The U.S.

During the quarter there were…

  1. Home
  2. Markets
  3. Other

Baby Steps And Intra-Day Thoughts

What is this? The S&P500 is down 1.5% intra-day? Do my eyes deceive me? How could this be possible?

Yes, it is true the S&P500 is off by more than 1%, and if my memory serves me correctly, this is the first pullback of more than 1% in over 2 months. But for those short equities, like me, let's face it, there is still a lot of work to do. I am sure the dip buyers are lurking.

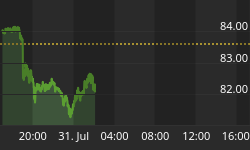
Look at an intra day 60 minute bar chart (figure 1) of the Ultra Short S&P500 ProShares (symbol: SDS). This is a 2 times leverage product that moves inverse to the S&P500. The black dots are key pivot points for intra day charts. Remember, key pivot points serve as areas of support and resistance.

Figure 1. SDS/ 60 minute
SDS  60-Minute

Today's stunning (yet so far meaningless) reversal has actually pierced a resistance level (somewhat emphatically) at 29.46. What a surprise. In this bullish run, other key levels have been penetrated but prices never really took off higher, so let's see how next week unfolds. Levels of resistance are noted on the chart, and I would consider it significant if the SDS could make it over the next resistance level at 30.82.

Remember, reversals (or changes in trends) start with baby steps, and if you are short equities, today you are given new life, but I would hardly say we are off and running yet. Baby steps.

In the ARL Advisers' Real Time Portfolio, I am long SDS. In other words, I am betting against equities.


Back to homepage

Leave a comment

Leave a comment