


LET'S LOOK AT THE S&P 500 DAILY CHART

This chart represents "TIME" analysis. The first leg was 97 days or within the 90 to 99 time window which is the most common window in time for this index. The next leg was 188 days and within the 180 day time window. Our forecast called for a run of 90 to 99 days which place the window to end this leg at May 6th through 15th. That is the probability, the reality is the price movement and volume and that will need to confirm the time probability but this is the highest probability now. This trend is currently in an exhaustion phase and will end soon, but will need some distribution then the correction.
NOW LET'S LOOK AT PRICE FOR THE S&P 500 sr1

ALL HIGHS AND LOWS ARE EXACT PROPORTIONS OF PREVIOUS MOVEMENTS. The normal extension of a range for a top in a 5th wave is either ¼ of the last leg up or in extreme case ¼ of the entire range up to last high. The last retracement was exactly 3/8 retracement and a 3/8 extension is 1255. The ¼ extension of the last range is 1220 and that was the minimum move we anticipated. If we use ¼ of the entire range from March through January the ¼ extension is 1270 and one other level at 1247. So the price resistance levels are 1220 to 1225, 1247 to 1255 and 1270.
Once this leg is complete there will be a correction but will also be the start of a lengthy sideways movement -- maybe out 6 months.
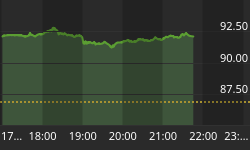
LET'S LOOK AT US T-BONDS

The low was September 1981 and the 30 year cycle is a window from February to September 2011. This is a daily chart and there has been a massive blowoff movement at the end of 2009. After the correction from the huge exhaustion the market showed a weak three thrust rally from June to November, normally a bearish pattern of trend but once complete the index only corrected and didn't show a big trend. This was followed by a two and possible three thrust pattern for another lower high. If "three thrusts" the index could trend down in a fast trend but the last test and the previous one may have been the same drive up and thus only one test of resistance. The correction between the two may not have been deep enough and the two runs against resistance could be from the same move up. Therefore another test is possible. The last low was 90 days low to low and 180 days high to low so the market could test the last highs again at 118. If that occurs and the index gives any indication of trending down, it could collapse. A three thrust pattern that cannot move far into the decline is a classic intermediate term counter trend pattern.


