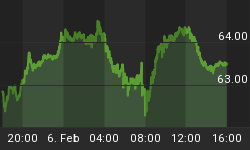
The public just got a little bit interested again on Friday. This is a good sign. I now follow the Rydex Precious Metals Fund as a proxy for retail investor interest/sentiment in the Gold sector. You can too if you want. The total assets in the fund fluctuate wildly, with assets flowing out of the precious metals fund (i.e. people withdrawing their money from the fund) when prices in the Gold patch fall and fund assets increasing when prices rice. The retail herd piles into a trade as prices move higher and higher and they become more and more bearish as prices move lower. Learning to break away from this unprofitable approach of the herd is an important step for every investor. Buy when the herd is uninterested and sell when they can't get enough.
I am not saying this Rydex retail interest sentiment indicator is perfect - no indicator is. On Friday, however, the assets in the Rydex fund "broke out" above $140 million. Here is a chart of the fund assets over the past 9 months or so that I created to show the last time a break out over $140 million occurred following a lull/nadir:

And here's a 1 year candlestick plot of the Gold price in U.S. Dollar terms to show where the two highlighted jumps over the $140 million mark in the previous chart occurred:

If we're setting up for another frenzied bull run in the Gold patch and recent history is a guide, we're likely to hit at least $300 million in assets for the Rydex Precious Metals Fund before the next peak. We may well go above the $300 million level if this is an extended bull move higher, as I am suspecting. I sure wouldn't want to bet against Jim Sinclair's call for a Gold price of $1650/oz by January, 2011.
The Rydex sentiment data is just another piece of the puzzle lining up in the Gold sector's favor. There is another sentiment indicator I will be watching carefully to help detect "the" major intermediate term top. It won't come into play for months, but it also remains in bullish alignment and shows the lack of "froth" in the Gold sector. It is the Central Fund of Canada to Gold ratio chart (CEF:$GOLD). Check this previous post if you're not familiar with my research on this interesting ratio.
Here is a 10 year weekly linear weekly plot of the CEF:$GOLD ratio chart with my thoughts:

It would make sense to have a powerful move higher now in Gold and silver and their related equities. I think the seasonals may end up being less relevant this year and the Gold sector will continue to power higher throughout the remainder of 2010, though with plenty of twists and turns along the way to keep the wall of worry intact. First thing's first, though. It's time to see how strong resistance is at the $1225/oz mark for Gold. How Gold stocks react to this inchoate short-term move in Gold should tell us how strong the resistance at $1225 is likely to be.
If major Gold stock indices strongly outperform the Gold price as it heads towards $1225, we should be set for a strong bull cycle thrust that may well last 6-12 months and Gold should blast through $1225 quickly. If Gold stocks lag or barely keep pace with the Gold price, then resistance at $1225 will likely be significant and we will then need to consolidate for a few weeks at the highs before a move to new all time highs in the U.S. Dollar-based Gold price can occur. I am betting on the former of these two scenarios but will react to what the market gives us.
I remain all in and thus as biased as can be, but I think the public and momentum traders are about to wander back over to the Gold patch for a while. Now that I'm properly positioned in my trading accounts to sell them what they want (at higher prices, of course), I'd like to formally welcome the herd back to the only secular bull market left standing. The secular point of recognition is drawing near for all things precious, shiny and metal.
Of course, my physical Gold is not for sale and I wouldn't consider selling it until the Dow to Gold ratio reaches 2. Oh yes, my sweet little paperbugs, we are going to get there whether you believe it or not. When the time comes, the fiat paper debt ticket proceeds from such a sale of physical metal will of course be used to purchase Gold stocks (if this sounds crazy, see my previous post on the subject).


