• 998 days Will The ECB Continue To Hike Rates?
  • 998 days Forbes: Aramco Remains Largest Company In The Middle East
  • 1,000 days Caltech Scientists Succesfully Beam Back Solar Power From Space
  • 1,400 days Could Crypto Overtake Traditional Investment?
  • 1,405 days Americans Still Quitting Jobs At Record Pace
  • 1,407 days FinTech Startups Tapping VC Money for ‘Immigrant Banking’
  • 1,410 days Is The Dollar Too Strong?
  • 1,410 days Big Tech Disappoints Investors on Earnings Calls
  • 1,411 days Fear And Celebration On Twitter as Musk Takes The Reins
  • 1,413 days China Is Quietly Trying To Distance Itself From Russia
  • 1,413 days Tech and Internet Giants’ Earnings In Focus After Netflix’s Stinker
  • 1,417 days Crypto Investors Won Big In 2021
  • 1,417 days The ‘Metaverse’ Economy Could be Worth $13 Trillion By 2030
  • 1,418 days Food Prices Are Skyrocketing As Putin’s War Persists
  • 1,420 days Pentagon Resignations Illustrate Our ‘Commercial’ Defense Dilemma
  • 1,421 days US Banks Shrug off Nearly $15 Billion In Russian Write-Offs
  • 1,424 days Cannabis Stocks in Holding Pattern Despite Positive Momentum
  • 1,425 days Is Musk A Bastion Of Free Speech Or Will His Absolutist Stance Backfire?
  • 1,425 days Two ETFs That Could Hedge Against Extreme Market Volatility
  • 1,427 days Are NFTs About To Take Over Gaming?
Trade In Counterfeit Goods Hits Half A Trillion Dollars

Trade In Counterfeit Goods Hits Half A Trillion Dollars

The counterfeit market has breached…

How The Ultra-Wealthy Are Using Art To Dodge Taxes

How The Ultra-Wealthy Are Using Art To Dodge Taxes

More freeports open around the…

What's Behind The Global EV Sales Slowdown?

What's Behind The Global EV Sales Slowdown?

An economic slowdown in many…

  1. Home
  2. Markets
  3. Other

A Dangerous Place To Be?

Today's chart is seen everyday by our paid subscribers (It is found in Section 4, Chart #3.)

A key aspect for this chart is whether or not it is above or below its support lines.

When this indicator is above the support line, the market is pretty resilient relative to more upside movements.

However, when the support line is broken to the downside, the market experiences a pull back or correction.

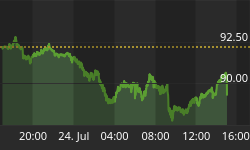
So, where is this indicator now?

It is slightly above a support line and testing it. This is a dangerous place to be, because if it falls below the support line, the market will eat the profits of those who are still long.

Support Indicator


Back to homepage

Leave a comment

Leave a comment