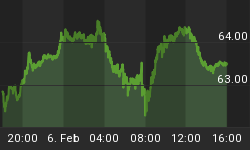
The markets gave back today on a strong down day. Internals (down stocks versus up stocks) were strongly in favor of the bears.
A couple days ago, I suggested now was a time for gain protection strategies, and that view seems to be correct. I also mentioned the turn up in the long bond would lead a down move in stocks, and that correlation is holding up. Lastly, I mentioned several days ago, "I was sticking with my call for some kind of top in the markets in April 2010". So far, so good!
Below is the daily chart of the SP500. What you'll notice is a potential repeat. In the last correction, the markets rolled over and tested their 50 day MA. They broke down further and widened out the Bollinger Bands confirming the correction was not finished.

Here we are again. Today, the SP500 tested its 50 day MA, and the Bollinger Bands are beginning to widen. All that's missing is some follow through to the down side. The MACD has plenty of room to continue supporting lower prices, as it has rolled over and heading lower.
NOTE: When I trade, I use a candlestick price chart with RSI and the MACD. When something looks interesting in either direction, I then overlay the Bollinger Bands. Then I run that through various time frames to see how it all fits together or not. This is my standard technical view, and while it's simplistic technical analysis, it works for me. The final thing I do is review my Elliott Wave view on top my analysis. I rarely lead with Elliott Wave Theory. Again, that's what works for me.
3 and 5 days ago, I added a couple of short positions. I took two of the gains off the table, as one stock fell 10 points yesterday and the gain was too good to pass up. I've never taken a loss closing out positions with gains. I know that sounds a tad ridiculous, but I try very hard to never let a trade become something it is not. I did add one more short position today because the pattern seemed low risk.
SHORTING: I rarely recommend shorting nor am I now, as I've learned it's by no means an investment strategy that fits within most investor profiles and risk tolerance levels.
Where do we go from here? If the market is not done going higher on this leg that started in early February 2010, we have a smaller splash higher, and if so, it happens very soon in a quick rebound, and most likely off the 50 day MA or the prior January 2010 peak. That's by no means my primary view, nor is it how I have my chips on the table currently. As always, we need to understand the alternate view, so we understand the likely risk should we be wrong. If you can live with that, than there's opportunities worth taking.
I'm on the side of repeating near term history, in that the markets move lower, and widen out the Bollinger Bands confirming more selling pressure to come. Does that mean the ultimate top is in, and the Elliott Wave Gurus are right and we plunge in a massive wave 3 down? Let's not get ahead of ourselves, time and price form need constant reviewing for confirmation of any view point.

As confirmation to something larger at hand, I would expect the MACD above on the weekly time frame to roll over and trend lower, which it has not done either, so far. That's one of the things I'm watching.
Hope all is well.


