


July 5, 2010
The S&P 500 is just about in official bear market territory (conventionally defined as down 20%). While the index closed on the stock market at about 1023 on Friday July 2, the CME Globex E-Mini index futures are at about 1006 at about 10:00 PM on July 5 before the July 6 open. That would place the index down 17.6%, and moving steeply downward.
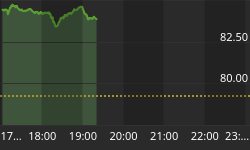
CME Globex E-Mini Futures (for July 6 at approx. 10:00 pm July 5) -- daily

CME Globex E-Mini Futures (for July 6 at approx. 10:00 pm July 5) -- monthly

We think it is rather hard to cling to the argument that what we have seen since late April is just a reaction or a correction. There are those who predict a year-end index price in the 1150 through 1300+ level, but whether they be right or wrong, we think a visit to 900 (and maybe less) is likely. (see most recent technical argument for downside targets).
Concerning the steepness of decline, this chart shows that the Rate of Change over 50 days (the approximate days since the April 26 high) is as steep as it has been in the negative direction since the early 2009 terminal crash stages.

That same chart shows the percentage of the S&P 500 constituent companies that present bullish Point and Figure charts. That measure also has not been as low, and declining, since the early 2009 terminal crash stages.
David Rosenberg, the former Merrill Lynch strategist, calls for a visit to 700 for the index based on a 10X P/E and a $70 EPS in 2011 (compared to 15X and $90+ EPS projections by some others). We wouldn't be shocked by a 700 test, but for now we are focused on another 10% down to about 900.
It's nice, we suppose to build expectations from a 2011 earnings projection, but in these difficult times, we think calling 2010 is a challenging enough task. If the Standard and Poor's projection of trailing "as reported" earnings through September 2010 is $65.83; and if you apply a below average multiple of perhaps 13, because of a below average macro-economic picture (compared to a long-term average of about 15-16 in average circumstances), then you get a projected index price level of about $856. We'll admit the extreme grossness of such projections and multiple selections, and call it an even 900 as a near-term price target.
We have been out of all equities for some weeks now (Europe was exited in Q4 2009, Emerging markets were exited in early Q1 2010, and US equities were fully exited in May between SP 500 1180 and 1120).
Barron's this week pointed out the battle of ideas between market technicians and fundamentalists, with these words:
"The charts, plainly, are delivering cause for concern, a fairly clear downward trend in the major indexes since the April high, and heavier selling on down days than there has been buying on rallies.
[However]
The cheapness of stocks being celebrated by some market fundamentalists can be measured in multiple ways beyond the simple price/earnings ratio.
Citigroup strategists point out that their gauge of stock-bond valuation shows equities at a deep and rare undervaluation versus high-grade bonds. Nomura quantitative strategist Joe Mezrich calculated last week that at present levels, stocks were implicitly pricing in five-year annual earnings growth slightly below zero, going from somewhat overoptimistic expectations at the start of the year to quite pessimistic ones now.
Credit Suisse strategist Doug Cliggott, who deftly foresaw the ongoing growth scare and market setback in the spring, puts fair value for the S&P between 1050 and 1150 for year end 2010, and says below that band he'd look to put cash into the market, albeit in defensive stocks.
... Doug Ramsey, research director at Leuthold Group ... is sticking for now with the stance that this remains a deep correction, not a fresh bear market. "
Our own view is that fundamental and technical review go hand in hand and should not be treated as mutually exclusive. In this specific instance, we think that even though there may be some attractive value stocks or dividend stocks out there now, they are likely to become yet more valuable or to yield yet more in the near-term. We'll wait.
Related Securities Tracking the S&P 500 Index: SPY, IVV and VFINX
Holdings Disclosure: As of July 5, 2010, we do not own any securities mentioned in this article in any managed accounts.


