


Summary of Index Daily Closings for Week Ending July 9, 2004
| Date | DJIA | Transports | S&P | NASDAQ | Jun 30 Yr Treas Bonds |
| July 5 | M A R K E T S C L O S E D J U L Y F O U R T H H O L I D A Y | ||||
| July 6 | 10219.20 | 3116.54 | 1116.18 | 1963.43 | 107^26 |
| July 7 | 10240.29 | 3150.08 | 1118.32 | 1966.08 | 107^27 |
| July 8 | 10171.56 | 3071.29 | 1109.10 | 1935.32 | 107^28 |
| July 9 | 10213.22 | 3087.97 | 1112.81 | 1946.33 | 107^31 |
| SHORT TERM FORECAST (Next Two Weeks) | ||||
| TREND | PROBABILITY | Legend | ||
| Substantial Rise | Low | |||
| Market Rise | Medium | Very High | 80% | |
| Sideways | Medium | High | 60% | |
| Market Decline | High | Medium | 40% | |
| Substantial Decline | Medium | Low | 20% | |
| Very Low Under | 20% | |||
| INTERMEDIATE TERM FORECAST (Next 12 Weeks) | ||||
| TREND | PROBABILITY | Substantial | 800 points+ (DJIA) | |
| Substantial Rise | Low | Market Move | 200 to 800 points (DJIA) | |
| Market Rise | Medium | Sideways | Up or Down 200 (DJIA) | |
| Sideways | Medium | |||
| Market Decline | High | |||
| Substantial Decline | High | |||
This week the Dow Jones Industrial Average closed down 69.61, in line with last week's Shortterm TII reading of negative (41.50). Trannies were the story for the week, down a whopping 58.20 points, 1.84 percent. Thursday's decline in the Trannies was the 29th worst of the past five years, in over 1250 trading days. Volume was down on rally days this week and was up on declining days. The number of new lows is catching up to new highs, is on the rise, and that bears watching for evidence of a significant decline.
All that being said, before this coming Crash gets legs, there should be a brief, uninspiring minirally starting over the next week from either current levels, or levels slightly below where major averages closed on Friday, July 9th. The impulsive move down from July 1st is losing some steam and looks to be nearing oversold levels. The coming mini-rally should provide more fuel to the coming decline, a necessary set-up for the next move down. In previous issues we have pointed out that during Crashes, markets rally as much as 30 percent of the time in order to work off oversold conditions. But the oversold indicators are the shorter-term measures, not the intermediate ones - many of which remain near overbought levels. Thus, our intermediate forecast remains Bearish.
| Equities Markets Technical Indicator Index (TII) ™ | ||||
| Week Ended | Short Term Index | Intermediate Term Index | ||
| Mar 5, 2004 | 16.00 | (17.17) | Scale | |
| Mar 12, 2004 | ( 9.00) | (14.70) | ||
| Mar 19, 2004 | (12.00) | (27.60) | (100) to +100 | |
| Mar 26, 2004 | 73.00 | (38.35) | ||
| Apr 2, 2004 | (3.00) | (35.61) | (Negative) Bearish | |
| Apr 16, 2004 | (43.00) | (29.90) | Positive Bullish | |
| Apr 23, 2004 | 94.00 | (22.69) | ||
| Apr 30, 2004 | (33.25) | (34.88) | ||
| May 7, 2004 | (28.75) | (47.75) | ||
| May 14, 2004 | (25.75) | (66.45) | ||
| May 21, 2004 | 22.00 | (67.23) | ||
| May 28, 2004 | ( 3.50) | (48.48) | ||
| June 4, 2004 | (55.75) | (34.07) | ||
| June 11, 2004 | (77.75) | (25.92) | ||
| June 18, 2004 | (40.25) | (31.17) | ||
| June 25, 2004 | (34.00) | (26.10) | ||
| July 2, 2004 | (41.50) | (27.64) | ||
| July 9, 2004 | (32.50) | (30.21) | ||
This week the Short-term Technical Indicator Index comes in at negative (32.50), indicating a market decline is probable, however later in the week a short-term bottom could occur and a mini-rally follow. This indicator is a useful predictor of equity market moves over the next two weeks, both as to direction and to a lesser extent strength of move. For example, readings near zero indicate narrow sideways moves are probable. Readings closer to +/-100 indicate with a higher degree of confidence that an impulsive move up or down is likely over the short run. Market conditions can change on a dime, or the Plunge Protection Team can come in and temporarily stop market slides, so it may be unwise to trade off this weekly measured indicator.
The Intermediate-term Technical Indicator Index is useful for monitoring what's over the horizon - over the next twelve weeks. It serves as an early warning system for unforeseen trend changes of considerable magnitude. This week the Intermediate-term TII comes in at negative (30.21).
In Wednesday, June 30th's Midweek Update issue we noted that the Transportation average was completing a blow-off topping spike, a parabolic rise in prices going virtually straight up. These patterns represent speculative excess and as a consequence, this pattern's subsequent fate does not lend itself to moderate declines or soft landings, but rather to vertical declines, crashes that occur within a very short time from when the vertical rise is recognized. The Trannies hit a high at 3,212 the next day, July 1st, and have plummeted 125 points - nearly 4 percent - straight down ever since. The pattern tells us Trannies have much further to fall.
So far the decline has only taken the Trannies about halfway down from their upper 2 percent Bollinger Band. The last two periods when the Trannies declined, they blew through their 50 Day Moving Average and fell slightly below their 200 day MA before bouncing higher. If the 200 day moving average is a minimum target, that would mean prices are headed toward 2,900ish.


The Dow Theory divergence between the Transportation average and the Industrials gives us a valuable clue as to what the accurate count is for the Elliott Wave analysis of the Bear Market rally since March 2003. The Trannies hit a new high in June 2004, completing a five wave impulse move up from March 2003 to complete wave C up of primary degree 2 up. The Industrials did not confirm. This non-confirmation not only validates the Dow Theory Sell signal from April 2004, but it also tells us wave v of C of primary degree 2 up in the Industrials truncated. The Trannies' sharp decline in July from its June top is impulsive and confirms the Elliott Wave count. So a Top is in, however it occurred on June 23rd, not the originally thought February 11th, 2004. Further confirmation that the Top was June 23rd, 2004 and not February 11th is the Fibonacci relationship of the number of trading days from the Grand Top on January 14, 2000 to the bottom of Primary degree wave 1 on October 9, 2002 to the Top June 23rd, 2004. There were 1115 trading days from 1/14/00 to 6/23/04. From 1/14/00 to 10/9/02 were 687 trading days, 2 days shy of a perfect Fibonacci .618 ratio. From 10/9/02 to 6/23/04 there were 428 trading days, 2 days more than a perfect Fibonacci .382 ratio. The Fibonacci ratio .382 to .618 is the phi golden ratio that appears so often throughout physics.
This explains why the expected crash feels like it is unfolding slowly. If we consider the Top 2/11/04, then the crash is taking forever to arrive. Now that we know 6/23/04 was really the Top, the crash can be expected to occur within the normal timeframe for previous crashes since the start of the Bear Market on January 14, 2004, between 31 and 67 trading days from 6/23/2004.
Crash # 1 in the chart above started 67 trading days from its prior top of 11,232 on 5/21/01. Prices drifted lower, then spiked higher to take out the shorts, until on 8/24/01 the market crashed 2,187 points (20.9%) over the next 15 trading days. Pre 9/11, the crash had already wiped out 818 of those points.
Crash # 2 began 39 trading days from the prior market top of 3/19/02, declining from 10,298 on 5/14/02 to 7,702 on 7/23/02 - a 2,596 point (25.2%) wipeout over 48 trading days. Once again, after an initial gentle sloping decline, the market spiked to clear out the shorts, then plummeted.
Crash # 3 started 31 trading days from its top, lasted 38 trading days, and then fell 1,318 points (14.9%), again after a gentle downward sloping decline was followed by a short-covering spike.
That leaves us with now, Crash # 4. If history is any lesson, we are currently completing the downward sloping pre-crash decline this July that will be followed by a sharp brief short-covering rally, perhaps taking a week or two to complete, to be followed by a precipitous decline into August or September 2004. If the crash occurs sometime between 31 and 67 trading days from June 23rd, then we are talking about it starting between August 6th and September 29th. No guarantees of course.

As we begin primary degree Elliott Wave 3 down, it is important to keep in mind the proportion and nature of the coming move. Primary Degree Wave 3 should take at least as much time, and extend further down than Primary degree wave 1 did. Inside this ominously Bearish Wave will be 3 lesser degree waves, but each of these waves will not feel "lesser" as each will be another stock market Crash, a drop of more than 15% over a 30 to 45 day period. I expect the first is underway and will complete before the election. Intermediate degree wave 2 up should carry into the election.

In Wednesday's Mid-week Market Update, we showed a Bearish Rising Wedge pattern in Dow Industrials' component 3M Co. The above chart (courtesy of www.stockcharts.com) shows a another bearish chart for a Dow Industrial's component stock, a textbook Bearish Head & Shoulders pattern in IBM. These bellwether stocks are telling us the DJIA is about to undergo heavy selling pressure.
IBM's price moved decisively below its long-term rising trend-channel's lower boundary in April/May. It then rose back up to the lower boundary, but found it formidable resistance, failed to return inside the rising trend-channel, then recently headed back down, finding support at the neckline of its Bearish Head & Shoulders pattern.
Because the Relative Strength Indicator is oversold, although it can remain oversold for a while, it is possible IBM will stage a small rally over the next week to ten days before heading down hard into August. The minimum downside target for IBM is around 72, based upon the Head & Shoulders pattern. With the MACD negative and sloping down hard, more downside could occur in the next few days, before a small rally unfolds that works off the oversold condition.

Another key Dow Industrial Average component, Citigroup, Inc., has formed a Bearish Rounded Top pattern. Inside this Rounded Top is a small, developing Bearish Head & Shoulders Pattern with a neckline at 45. Should prices move down to the 42 area, we would see a much larger Bearish Head & Shoulders formation.
The decline during July has sent prices meaningfully below their long-term rising trendchannel's lower boundary. Not good.
What is more alarming is that Citigroup's 50 Day moving average has broken significantly below its 200 day moving average. The last three times this happened we had immediate subsequent declines of roughly 30 percent (Aug/Sep 2001), 19 percent (Jan-Mar 2002), and 46 percent (Jun-Aug 2002). The RSI is not yet oversold and the MACD continues to break down.
To summarize, although the DJIA is hesitating at its 200 day moving average, it should decline a hundred points or more below it before rising for a week or two into mid/late July. Following that should be a precipitous decline that concludes in time for a feel-good rally into the fall election, helping Dubya.
The Economy:
A dull and uninteresting news week. Retailers reported disappointing Sales for the month of June according to www.CNNMoney.com on Thursday. This was not unexpected for us as we demonstrated Bearish patterns in charts of the Retail Holders Index (RTH) and Wal-Mart (WMT) in June 25th's issue no. 61 (available in the archives at www.technicalindicatorindex.com).
The Institute for Supply Management reported that its measure of Service Sector growth fell sharply to 59.9 in June from 65.2 in May.
The Labor Department reported a sharp decline in Initial Claims for jobless benefits, but that is normal because of a seasonal adjustment they apply to the numbers for the annual furlough of auto workers while factories are refitted for the new model year.
Iraq's strategic oil pipeline was sabotaged, so Crude rose to $40 a barrel.
The Philadelphia Inquirer put some hard numbers to the empirical observation I've been making recently about office vacancies in the Philadelphia area. Nearly 25 percent of the 54 million square feet of office space is vacant in the Philadelphia suburbs according to Cushman & Wakefield Inc., the national real estate firm, as noted in an article in Monday, July 6th, 2004's Philadelphia Inquirer by Henry J. Holcomb. Could this be a sign of the end of the real estate bubble?
Money Supply, the Dollar & Gold:
M-3 was up a whopping 31.7 billion for the latest reporting week on a seasonally adjusted basis. It is now up 61.2 billion over the past 3 weeks, and $204 billion over the past ten weeks, rising at an annualized clip of 11.7 percent. After a brief pause, it seems the spigots are opened again. This is not surprising as the same thing happened the last time equities declined sharply in April/May 2004. With another sharp decline in the making, the Fed is to the rescue once again. Their infusions kept the decline at bay a few months back. Perhaps M-3 will mitigate this decline as well. The non-seasonally adjusted figures are flat for the past six weeks. This may suggest that M-3 is not going to be the force for stopping equities it was in April/May when these two M-3 measures rose more in sync with each other.
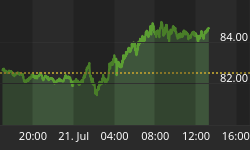
The U.S. Dollar has formed a textbook perfect Bearish Head & Shoulders pattern that has a minimum downside target of 82, probably sometime over the next 45 days. This pattern coincidentally has formed at the Top of the Dollar's long-term declining trend-channel, a place where prices want to decline from anyway. The bottom of the trend-channel confirms a price target similar to the Head & Shoulder pattern's. Over the short-term, the Dollar may rally a bit as the RSI is nearing oversold levels and prices have reached the bottom 2 percent Bollinger Band, a place where rallies typically begin. This rally should be brief and uninspiring.
Watching Gold the metal is like watching Rocky Balboa stay on his feet, wailing away at the chiseled champ, about to go down, but won't, hanging in, heart and soul fighting to the death, determined to come out on top. Gosh, don't ya just wanna see Gold break out above that Bearish Double Top, crawl to the ceiling of the trend-channel, and rise up like a gladiator? If prices can rally above 435, it will negate the Bearish Double Top and Gold will soar. How could this fundamentally happen? Try this for a scenario. Equities plummet and the Federal Reserve pumps massive amounts of money into the system. The Dollar crumbles as a result, and Gold reacts by rising. Since markets discount the future, Gold could be smelling that scenario now and starting its rise early. So far, so good for Gold.


The picture for the Gold Mining stocks ($HUI) has fuzzied a bit as the symmetrical triangle pattern from May/June 2004 has morphed into a Bullish Ascending Triangle pattern, a possible bottom formation. This is in contrast to Bearish patterns and indicators that continue to appear on this chart. The Elliott Wave count needs a fifth wave down to complete. Triangles are typical formations for Wave 4s so this pattern looks to fit a normal Elliott Wave impulse move down. A Bearish Rounded Top pattern also has set up shop and implies that since prices sit due east (picture a globe), the next course for prices to follow is due south. If we are to see prices decline further, the likely target is below 150. Prices could rise a bit further, to the 211 area and meet the normal 61.8% retrace standard for a corrective rally, wave 4 up. Currently prices sit on the 50% retrace point, at about 202. This is also the confluence point where the upper trend-line of the downward sloping trend-channel sits, and is the halfway point between the 50 day and 200 day moving averages. The key will be to see if prices break out higher or lower from here, although if higher, the ascending triangle could simply morph into a rising bearish wedge pattern. Above 235 would confirm a reversal to the upside. A break below 175 confirms a continuation down into the 150 area or below.


The VIX has formed a Bullish Head & Shoulders pattern which implies fear will soon be entering the equity markets as options writers raise the premium for writing puts. The SPX/VIX ratio remains in Crash territory, at 70.52 on July 9th, 2004. This ratio has near-perfect correlation to the S&P 500's price movements and has risen above 68.00 immediately before 5 previous Crashes since 1998. It currently is telling us another Crash is imminent. Bottoms occur when this ratio falls below 35.00. We are nowhere near that level at this time.
Bonds and Interest Rates:
The above chart (courtesy of www.stockcharts.com) shows a massive Bearish Head & Shoulders pattern in the U.S. Bond. This ominous formation has taken place over a two year period. We are currently in a correction phase for bond prices, rising to what looks like will be a 61.8% retrace of the decline that formed the Right Shoulder to a target of about 110. The RSI is near overbought levels, telling us this rally should end over the next 30 to 45 days or so. Then prices should make a beeline down, heading toward the 80's. This scenario is interesting because it would seem that with an equity market collapse over the horizon, there would be a flight to quality and U.S. Bonds would fly high. But perhaps it will be the massive infusions of fiat currency, the monetization of our Treasury Debt (the Fed infusing M-3 into the system by buying U.S. Treasuries in response to the equity calamity) that will sink the U.S. Dollar and sour foreigners on U.S. Treasuries. Perhaps.
Bottom Line:
The Intermediate-term picture is for an equity market collapse. Technical Indicators all over the place warn us that danger is near. The financial system is at one of its most fragile points. Russian banks are collapsing. Asian equity markets have crashed. We have a Dow Theory Sell Signal. The Three Peaks and a Domed House pattern monitored so well by Tim Wood (www.cyclesman.com) says a Crash is next. The Major U.S Averages have Bearish patterns. Dow Component stocks have Bearish patterns. The SPX to VIX ratio says Crash. Sure, there might be one or even two minor rallies left before the bottom falls out, but that's about it. This is a very dangerous time. All it would take is one trigger event, one unexpected disaster that the general public sees, and equities will tank. That is what the Technicals are telling us, the language of the markets, communicating what they discount from the future. Caution is warranted.
"Now He said to them,"These are My words which I spoke to you
while I was still with you,that all things which are written about Me
in the Law of Moses and the Prophets and the Psalms must be fulfilled."
Then He opened their minds to understand the Scriptures,
and He said to them, "Thus it is written, that the Christ should suffer
and rise again from the dead the third day;
and repentance for forgiveness of sins
should be proclaimed in His name
to all the nations, beginning from Jerusalem."
Luke 24: 44 - 47
You can hear an interview Tim Wood conducted with Robert McHugh Thursday July 8th, 2004 by visiting www.cyclesman.com It is available in his Subscriber's Area
Special Note: Be sure to register under the subscribers' section at www.technicalindicatorindex.com for e-mail notifications of our new mid-week market analysis, usually available on either Tuesdays or Wednesdays. These midweek updates will only be available via e-mail and in the future will not be posted on the web.
| Key Economic Statistics | ||||||||
| Date | VIX | Mar. U.S. $ | Euro | CRB | Gold | Silver | Crude Oil | 1 Week Avg. M-3 |
| 2/06/04 | 16.00 | 86.15 | 126.83 | 260.50 | 403.6 | 6.27 | 32.43 | 8891.6 b |
| 2/13/04 | 15.62 | 85.68 | 127.25 | 264.85 | 410.8 | 6.58 | 34.56 | 8904.2 b |
| 2/20/04 | 16.05 | 87.40 | 126.96 | 264.50 | 397.5 | 6.53 | 34.25 | 8942.7 b |
| 2/27/04 | 14.53 | 87.89 | 124.52 | 273.90 | 396.8 | 6.71 | 36.16 | 8962.4 b |
| 3/05/04 | 14.52 | 88.75 | 123.28 | 274.00 | 401.6 | 6.99 | 37.26 | 8974.1 b |
| 3/12/04 | 18.21 | 89.60 | 121.80 | 272.00 | 395.6 | 7.06 | 36.19 | 8964.0 b |
| 3/19/04 | 19.15 | 88.56 | 122.47 | 280.20 | 412.7 | 7.56 | 37.62 | 9005.8 b |
| 3/26/04 | 17.12 | 89.30 | 120.90 | 278.25 | 422.3 | 7.71 | 35.73 | 9015.3 b |
| 4/02/04 | 15.81 | 88.80 | 121.12 | 280.00 | 421.1 | 8.15 | 34.39 | 9071.5 b |
| 4/08/04 | 16.38 | 89.82 | 120.56 | 284.00 | 419.9 | 8.09 | 37.14 | 9060.6 b |
| 4/16/04 | 15.00 | 90.18 | 119.50 | 276.75 | 401.6 | 7.14 | 37.74 | 9077.8b |
| 4/23/04 | 14.01 | 91.34 | 118.18 | 267.50 | 395.7 | 6.16 | 36.46 | 9085.3 b |
| 4/30/04 | 16.69 | 90.76 | 119.70 | 270.75 | 387.5 | 6.07 | 37.38 | 9134.5 b |
| 5/07/04 | 18.13 | 91.30 | 118.83 | 270.40 | 379.1 | 5.58 | 39.93 | 9193.3 b |
| 5/14/04 | 18.47 | 91.81 | 118.69 | 267.00 | 377.1 | 5.72 | 41.38 | 9195.1 b |
| 5/21/04 | 18.44 | 90.53 | 120.05 | 268.75 | 384.9 | 5.87 | 39.93 | 9240.6 b |
| 5/28/04 | 15.52 | 88.98 | 122.10 | 276.25 | 394.0 | 6.11 | 39.88 | 9214.3 b |
| 6/04/04 | 16.57 | 88.50 | 122.93 | 274.75 | 391.7 | 5.81 | 38.49 | 9218.2 b |
| 6/11/04 | 15.10 | 89.23 | 121.01 | 269.25 | 386.6 | 5.78 | 38.45 | 9228.0 b |
| 6/18/04 | 14.95 | 89.41 | 121.17 | 267.75 | 395.7 | 5.98 | 39.00 | 9267.5 b |
| 6/25/04 | 15.19 | 89.22 | 121.41 | 270.75 | 403.2 | 6.12 | 37.55 | 9257.6b |
| 7/02/04 | 15.15 | 88.18 | 123.09 | 265.50 | 398.7 | 6.01 | 38.39 | 9289.3 b |
| 7/09/04 | 15.78 | 87.41 | 124.10 | 269.00 | 407.0 | 6.46 | 39.96 | - |
Note: VIX, CRB, Gold, Silver, Oil and M-3 are up. Dollar is down.


