


From this perspective, the equity markets have a bearish look.
Figure 1 is a weekly chart of the S&P Depository Receipts (symbol: SPY). Key pivot points, which highlight areas of buying (support) and selling (resistance), are shown on the graph. Prices are currently below the most immediate key pivot point at 107.58. A weekly close above this level is constructive, but until that happens, the trend is most likely down.
Figure 1. SPY/ weekly
Figure 2 is a weekly chart of the Ultra Short S&P500 ProShares (symbol: SDS). This 2x leverage ETF moves inversely to the S&P500. With prices above the most recent pivot at 33.58 and above the 40 week moving average, this is a bullish looking chart. What is good for SDS is not good for the S&P500. A weekly close below support at 33.58 would turn this chart from up to down.
Figure 2. SDS/ weekly
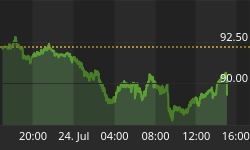
Figure 3 is a weekly chart of the Power Shares QQQ Trust Series (symbol: QQQQ). Resistance remains at 45.01, and until this level is cleared on a weekly closing basis, the trend remains down.
Figure 3. QQQQ/ weekly
Figure 4 is a weekly chart of the Ultra Short QQQ ProShares (symbol: QID). This 2x leverage ETF moves inversely to the NASDAQ 100. QID closed last week at 18.47, which happens to be in the middle of our support zone, 18.39 to 18.49. At best, this puts QID at neutral. A weekly close above 18.49 would be bullish for QID, which is bearish for the NASDAQ 100.
Figure 4. QID/ weekly
So what is the state of the market? With the SPY and QQQQ both below resistance, this is bearish. With SDS bullish, this is bearish for equities. QID has yet to join the bullish camp (which is bearish for equities), but at best, QID is neutral. The consensus is bearish for equities.
Resistance levels are noted, and a weekly close above those levels would change the outlook. Support levels are also noted, and a weekly close below those levels would likely lead to a waterfall decline. Buying "should" materialize at current levels, but if it doesn't, then this would be a failed signal. Failed signals can lead to much lower prices, and likely cement a bear market.


