


Trading commodities and indexes through the use of exchange traded funds sure keeps things simple for an average trader. These funds allow individual investors to buy and sell things like gold, silver, oil, the sp500 and other investments which where not available only few months ago like "wheat" for example.
One of the nice things with ETFs is that is allows everyone to follow the price of a commodity or index using any charting website and can even apply indicators to help spot key support and resistance levels using volume by price analysis. There is no need for a expensive data feeds, charting programs and you don't have to worry about contract expiration.
Below are a few charts of the trend and my short term forecast.
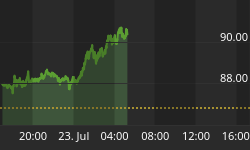
GLD - Gold Bullion ETF
As you can see gold broke out of its support zone this week and popped into the next resistance level. This is very typical price action in the stock market. It is important to look at the price charts like an apartment building. It's nothing but a bunch of floors and ceilings.
How it works; if a ball breaks though a floor it will naturally fall to the next floor and bounce. The same for if a ball breaks through a ceiling, it will hit the next ceiling then bounce back down. This is essentially how the market moves.

SLV - Silver ETF
Silver is forming a large pennant and nearing its apex. With the amount of volume traded within this large volume channel I would expect a sharp breakout once a direction is made.

USO - Oil Traded Fund
Crude oil had a funky day. Early Wednesday morning in pre-market trading we saw virtually every investment drop at the same time which was strange. Anyways the US dollar dropped sharply and oil when down also. Normally as the dollar drops oil rockets higher but that was not the case today.
Currently oil is trading between two trendlines and is trying to hold up. If we get a breakdown then we could see a sharp drop in oil over the next 1-2 weeks.

SPY - SP500 ETF Trading Fund
The SP500 is trading within a high volume channel, similar to silver. Once a breakout in either direction is made I would expect a sizable move lasting a few weeks to occur.

Mid-Week Commodity and Index ETF Report:
In short, the market looks bearish for the short term of 5-10 trading sessions. This is because everything looks to be trading near resistance levels. That naturally brings sellers out of the woodwork putting pressure on prices.
Silver and gold stocks tend to lead the metals sector on breakouts so it will be important to keep an eye on them as we near a possible breakout or breakdown in the metals. If you see SLV or GDX ETFs out performing the GLD gold fund by 2-3x then I would expect to see gold move higher later that session or the following day.
The US dollar trend usually helps to identify if oil will have downward pressure or not. Also energy stocks tend to lead the price of oil by a few hours and some times a day. I keep an eye on XLE energy etf for a feel of how the energy stocks are doing and also UUP US dollar fund.
As for equities tech, financials and the Russell 2K (small cap stock) tend to lead the way for the broad market. Watching XLK, XLF and IWM help to confirm breakouts.
If you would like to get my trading analysis and alerts please join my free newsletter at: www.GoldAndOilGuy.com


