


9/1/2010 9:41:20 AM
No reproduction, retransmission, or other use of the information or images is authorized. Legitimate news media may quote representative passages, in context and with full attribution, for the purpose of reporting on our opinions. Media interested in speaking to Mr. DeVincentis should email jay@stockbarometer.com to arrange a call.
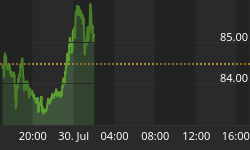
Markets move to the top of their current range on bullish economic news overseas.
When markets attempt to put in tops and bottoms, there's usually quite a bit of volatility - in fact, the level of volatility can give you a good indication of that. What normally happens is the market gets a piece of news that acts as a catalyst. The news is somewhat out of the blue and catches people by surprise. (although we were looking at it). The next thing that will happen is that the market will respond favorably to a bad economic report - and we got a little of that this morning.

Here are this week's economic reports.

On to the charts:

Stock Barometer Analysis
The barometer remains in Buy Mode and the markets have passed the 'retest' - the next thing is the market will test the highs. If this test passes, we have a green light for at least a week or two as the market moves to over bought.
The Stock Barometer is my proprietary market timing system. The direction, slope and level of the Stock Barometer determine our outlook. For example, if the barometer line is moving down, we are in Sell Mode. A Buy or Sell Signal is triggered when the indicator clearly changes direction. Trend and support can override the barometer signals.
Money Management & Stops
To trade this system, there are a few things you need to know and address to control your risk:
- This system targets intermediate term moves, of which even in the best years, there are usually only up to 7 profitable intermediate term moves. The rest of the year will be consolidating moves where this system will experience small losses and gains that offset each other.
- This system will usually result in losing trades more than 50% of the time, even in our best years. The key is being positioned properly for longer term moves when they come.
- Therefore it is vitally important that you apply some form of money management to protect your capital.
- Trading a leveraged index fund will result in more risk, since you cannot set stops and you cannot get out intraday.
Accordingly;
- Make sure you set your stops so that you can lose no more than 2% per trade (based on the QQQQ if you're trading leveraged funds and options with our trading service).
Potential Cycle Reversal Dates
2010 Potential Reversal Dates: 1/19, 1/28, 3/2, 3/23, 4/7, 5/30, 6/10, 6/28, 7/10, 8/13, 9/7, 10/2, 10/27. We publish dates up to 2 months in advance.
The next likely top will be 9/7 to 9/14, followed by a larger move lower into 10/2.
My Additional timing work is based on numerous cycles and has resulted in the above potential reversal dates. These are not to be confused with the barometer signals or cycle times. However, due to their past accuracy I post the dates here.
2009 Published Reversal Dates: 1/20, 2/11, 3/7, 3/15, 4/8, 4/16, 4/27, 5/7, 6/8, 7/2, 7/17, 9/14, 10/10, 10/24, 11/12, 11/30, 12/9, 12/21, 12/29. 2008 Potential Reversal Dates: 12/31, 1/11, 2/1, 2/13, 3/6, 4/5, 4/22, 5/23, 6/6, 6/27, 7/13, 9/2, 10/3, 10/22, 11/10, 12/11. 2007 Potential Reversal Dates: 1/10, 1/14, 1/27, 1/31, 2/3, 2/17, 3/10, 3/24, 4/21, 5/6, 6/15, 8/29, 10/19, 11/29, 12/13, 12/23, 12/31, 1/11/08. 2006 potential reversal dates: 1/16, 1/30, 2/25, 3/19, 4/8, 5/8, 5/19, 6/6(20), 7/24, 8/20, 8/29, 9/15, 10/11, 11/28. 2005 Potential reversal dates: 12/27, 1/25, 2/16, 3/4, 3/14, 3/29, 4/5, 4/19, 5/2, 6/3, 6/10, 7/13, 7/28, 8/12, 8/30-31, 9/22, 10/4, 11/15, 11/20, 12/16.
Spread Indicators
Use the following spread/momentum indicators to assist in your trading of the QQQQ, GLD, USD, USO and TLT. They are tuned to deliver signals in line with the Stock Barometer and we use them only in determining our overall outlook for the market and for pinpointing market reversals. The level, direction, and position to the zero line are keys in these indicators. For example, direction determines mode and a buy signal 'above zero' is more bullish than a buy signal 'below zero'.
QQQQ Spread Indicator (NASDAQ:QQQQ)

The QQQQ Spread Indicator will yield its own buy and sell signals that may be different from the Stock Barometer. It's meant to give us an idea of the next turn in the market.
Gold Spread Indicator (AMEX:GLD)

Want to trade Gold? Use our signals with the Gold ETF AMEX:GLD. Gold gives us a general gage to the overall health of the US Economy and the markets.
US Dollar Index Spread Indicator (INDEX:DXY)

Want to trade the US Dollar? Use our signals with the Power Shares AMEX:UUP: US Dollar Index Bullish Fund and AMEX:UDN: US Dollar Index Bearish Fund.
Bonds Spread Indicator (AMEX:TLT)

Want to trade Bonds? Use our signals with Lehman?s 20 year ETF AMEX:TLT. The direction of bonds has an impact on the stock market. Normally, as bonds go down, stocks will go up and as bonds go up, stocks will go down.
OIL Spread Indicator (AMEX:USO)

Want to trade OIL? Use our signals with AMEX:USO, the OIL ETF. We look at the price of oil as its level and direction has an impact on the stock market.
Supporting Secondary Indicator

We daily monitor hundreds of popular and proprietary technical indicators that break down market internals, sentiment and money flow to give us unique insight into the market. We feature at least one here each day in support of our current outlook.
Summary of Daily Outlook
We are in Buy Mode, looking for the markets to move higher into 9/7 to 9/14.
Bullish overnight economic news from China (and lesser so Australia) has lifted the market in the morning. But we're by no means out of the woods. More economic reports will come out today that can change the landscape very quickly and remember, most morning gaps get filled. If it doesn't get filled, look for short covering to fuel the market for an upward 3 gaps.
Here are the indices pivots for today's trade.

Here's a deeper look at the S&P Futures - these levels are very important if you're going to day trade the market.

These levels can be important for both day traders and investors. How? Well, if you are going to take a stock position, it's always best to get the most efficient entry. Understanding that there are key pivots during the day and key levels that futures traders look for, will help you figure a better entry price (instead of just buying at the open). Combine these levels with the timing of the economic reports on the list at the top of the page, and you can really catch some nice swings in the market. More efficient trade entry increases your relative profit per trade.
I'll be in the chat room from 9:30 to 10:30 (EDT) this morning if you have any questions.
If you have any questions or comments, email me at Jay@stockbarometer.com.
Regards,


