


Last week's bullish signal is this week's perfect four as all four sentiment indicators are issuing buy signals. Essentially, the "smart money" is buying while the "dumb money" is bearish.
The "Dumb Money" indicator (see figure 1) looks for extremes in the data from 4 different groups of investors who historically have been wrong on the market: 1) Investors Intelligence; 2) Market Vane; 3) American Association of Individual Investors; and 4) the put call ratio. The "Dumb Money" indicator remains bearish for a second week in a row and this is a bullish signal. For a broader look at the significance of a bullish signal from the "Dumb Money" indicator, please check out the following article from March, 2009: "Putting a Bullish Signal Context".
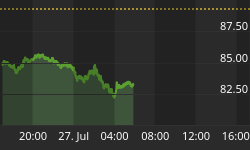
Figure 1. "Dumb Money"/ weekly
The "Smart Money" indicator is shown in figure 2. This is calculated utilizing data about SP100 options, which is thought to represent large traders. The "smart money" has turned bullish. Previously, the "smart money" calculations utilized data from the NYSE; this data is no longer publicly available.
Figure 2. "Smart Money"/ weekly
Figure 3 is a weekly chart of the S&P500 with the InsiderScore "entire market" value in the lower panel. From the InsiderScore weekly report: "Market-wide sentiment remained cautiously positive last week as the gap between the number of companies with buying and those with selling widened. Buying, however, was once again scattershot and not very telling from a macro perspective."
Figure 3. InsiderScore "Entire Market" Value/ weekly
Figure 4 is a weekly chart of the S&P500. The indicator in the lower panel measures all the assets in the Rydex bullish oriented equity funds divided by the sum of assets in the bullish oriented equity funds plus the assets in the bearish oriented equity funds. When the indicator is green, the value is low and there is fear in the market; this is where market bottoms are forged. When the indicator is red, there is complacency in the market. There are too many bulls and this is when market advances stall.
Currently, the value of the indicator is 47.56%. Values less than 50% are associated with market bottoms.
Figure 4. Rydex Total Bull v. Total Bear/ weekly
Improve your market timing with Premium Content from TheTechnicalTake.
The Premium Content service is the best $104 you will ever spend on market research. The daily report is meant to keep you on the right side of the market and improve your market timing. That's 40 cents a day!
We know the Premium Content service has been useful because we can track the number of subscribers who download and read the reports everyday. Over 90% of the subscribers access this research everyday!
To learn more about this service click here: Premium Content
To subscribe to Premium Content click here: Subscribe


