• 948 days Will The ECB Continue To Hike Rates?
  • 948 days Forbes: Aramco Remains Largest Company In The Middle East
  • 950 days Caltech Scientists Succesfully Beam Back Solar Power From Space
  • 1,350 days Could Crypto Overtake Traditional Investment?
  • 1,355 days Americans Still Quitting Jobs At Record Pace
  • 1,356 days FinTech Startups Tapping VC Money for ‘Immigrant Banking’
  • 1,360 days Is The Dollar Too Strong?
  • 1,360 days Big Tech Disappoints Investors on Earnings Calls
  • 1,361 days Fear And Celebration On Twitter as Musk Takes The Reins
  • 1,362 days China Is Quietly Trying To Distance Itself From Russia
  • 1,363 days Tech and Internet Giants’ Earnings In Focus After Netflix’s Stinker
  • 1,367 days Crypto Investors Won Big In 2021
  • 1,367 days The ‘Metaverse’ Economy Could be Worth $13 Trillion By 2030
  • 1,368 days Food Prices Are Skyrocketing As Putin’s War Persists
  • 1,370 days Pentagon Resignations Illustrate Our ‘Commercial’ Defense Dilemma
  • 1,370 days US Banks Shrug off Nearly $15 Billion In Russian Write-Offs
  • 1,374 days Cannabis Stocks in Holding Pattern Despite Positive Momentum
  • 1,375 days Is Musk A Bastion Of Free Speech Or Will His Absolutist Stance Backfire?
  • 1,375 days Two ETFs That Could Hedge Against Extreme Market Volatility
  • 1,377 days Are NFTs About To Take Over Gaming?
  1. Home
  2. Markets
  3. Other

Some Simple TA: TLT

I have been bullish for some time on long term US Treasury bonds, and despite the recent pullback, I remain so.

The longer term indicators that I wrote about several weeks ago have not changed, but they would be unlikely do so at this juncture. Furthermore, when I showed that data, those indicators had just started to turn up suggesting that the upward trend in long term Treasury bonds was in its infancy.

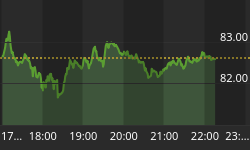
On a short term basis, the i-Shares Lehman 20 plus year Treasury Bond Fund (symbol: TLT) has pulled back to support or its last "breakout" point. I suspect there will be buying interest at these levels. See figure 1 a daily chart of TLT where I highlight several technical tidbits that suggest that TLT may find buying support.

Figure 1. TLT/ daily
TLT - Daily Chart

Technical Tidbit #1: TLT has pulled back to a key pivot point and the rising (green) trend line that has defined the explosive move over the past couple of months.

Technical Tidbit #2: The indicator in the lower panel utilizes data from Market Vane and assesses investor bullish/ bearishness on Treasury bonds; with the indicator below the lower trading band, these investors have turned bearish on Treasury bonds.

In summary, this seems like a low risk entry point on TLT. The longer term trend is up, sentiment has turned bearish, and prices are at support levels. As always, failure at this level would be telling.


Back to homepage

Leave a comment

Leave a comment