


LET'S LOOK AT THE S&P 500 INDEX DAILY CHART

Four weeks ago on Squawk box I said the index would go up into the 1st of October for a possible top at a price close to 1150. When the index goes into the time and price for a high there needs to be something on the chart to indicate some validity to that probability since there are no certainties only probabilities.
It is very seldom the same pattern of trend or top will show up on the same chart page. But there are now three instances where this has occurred. First notice the April high, there was a small exhaustion, followed by a two day counter trend down and a rally back towards the high that failed two days later. But within that rally was a reversal day (R) and for 30 years I've been viewing the lack of "follow through" as significant. In all three instances two days later the trend appeared down. During the April top the failure was followed by a lower high and a trend down. The July/August top showed an exhaustion followed by a three day move down and a rally back to new highs. There was again a reversal day and limited "follow though" and an immediate move down. Currently, circumstances are the same only there is a reversal day down at the high day. But that reversal day has not broken any support yet. I am anticipating the move down holding 1080 rather than starting a bear trend, if I'm correct about a move down occurring now.
LET'S LOOK AT THE 1975 S&P 500 INDEX

This was the last time the index ran out a 5 year bear cycle and I believe is now the current dominant cycle. If this is not rolling over into a bear trend now the likely scenario is another leg up after this correction and a large distribution before the bear campaign as occurred in 1976. I've market on the chart were we could be in that scenario. But I am getting very concerned about the CAC 40 and the DAX as the patterns they are showing could be a top with the very weak 5 wave structures below a high. This is the same pattern of trend that brought in the 2000 top in the S&P 500 index. We'll look closely at those indexes next report.
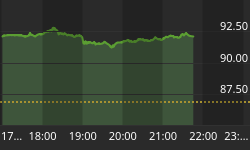
LET'S LOOK AT THE DOLLAR INDEX

Two weeks ago on Squawk Box I also said the DOLLAR INDEX had completed an intermediate term counter trend rally and was going to resume the fast trend down. The next chart is weekly and shows the 3/8 retracement. Remember a 3/8 retracement is relatively small and leaves the downtrend in a strong position for the next thrust down. We had two dates that could end the trend, October 4th and October 29th as the preferred date. Support is 77.9, 76.8 and 75.6.


