


| TREND | MOMENTUM | COMMENT | |
| Long-term | 2 of 2 are BUY | ||
| Intermediate | 3 of 3 are BUY | 3 of 5 are NEUTRAL | SPY ST Model in BUY mode; Non-Stop in BUY mode. |
| Short-term | Model is BUY | 6 of 6 are NEUTRAL | The trend is up, I hold tiny long position over the weekend. |
| GANN DAY | MOON:SOLAR | CYCLE | CONCLUSION |
| 10/10-10/11 | 10/07 : 10/08 | 10/11 | Next pivot date: 10/05 - 10/11 |
| BULLISH | 0.1.1 SPX Intermediate-term Trading Signals: Head and Shoulders Bottom breakout, target 1242. 09/27 Market Recap: 9 POMO within 20 trading days means 14%+ up in 3 months. 10/01 Market Recap: Positive September plus mid-term election means 11%+ up to year end. 1.2.0 INDU Leads Market: mini SPX target 1173. |
| BEARISH | 1.0.6 SPY Unfilled Gaps: 19 unfilled gaps, the max is 19. 10/01 Market Recap: AAII bull ratio (4-week average) too bullish. 10/01 Market Recap: Commercial (smart money) short Nasdaq 100 heavily according to COT Report. 6.3.1b Major Accumulation Day Watch: 2 consecutive down days after MAD was a bad sign. 6.4.3a SPY Bearish Reversal Day Watch: Bearish Reversal Day, pullback? *10/08 Market Recap: Up off-season usually means down earning season. *6.1.9a Extreme ISEE Index Readings Watch: SPX will close below 1165 within 2 days? |
| SPY SETUP | ENTRY DATE | STOP LOSS | INSTRUCTION: Mechanic signals, back test is HERE, signals are HERE. TRADING PLATFORM: SSO/SDS, UPRO/SPXU |
| Non-Stop | 09/07 L | N/A | Partial profits on 09/24. |
| ST Model | 09/24 L | Breakeven |
SHORT-TERM: NO 2 CONSECUTIVE UP DAYS FOR 3 WEEKS, UPTREND IS WEAKENING
In 10/07 Market Recap, I mentioned that all the recent huge up days (up more than 1.5%) simply had no follow-through thereafter. From another angle, the chart below compares what happened when uptrend was young vs old, apparently the current uptrend is weakening, a top of some kind could be approaching. Of course, to timing a top is very difficult, so again I don't mean you should short, just I feel it's not the right time to get too bullish.

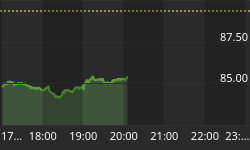
1.0.0 S&P 500 SPDRs (SPY 60 min), the negative divergence is simply too large which looks bearish too me, so we may see the price channel support being tested the next week.

INTERMEDIATE-TERM: BEARISH BIASED
Maintain the intermediate-term bearish view. Below are summaries of all the arguments I've been blah blah recently:
- As mentioned in 10/01 Market Recap, commercial (smart money) holds record high short positions against Nasdaq 100.
- As mentioned in 10/01 Market Recap, AAII bull ratio (4-week average) is way too bullish.
- As mentioned in 10/01 Market Recap, institution selling keeps increasing.
- As mentioned in 10/05 Market Recap, statistically, a strong off-season could mean a weaker earning season.
All the most recent charts supporting the above arguments are listed below for your reference. Among them the statistics chart about off season vs earning season is from Bespoke and Sentimentrader (I combined them together) while the Institutional Selling Actions char is from stocktiming.


SEASONALITY: OCTOBER EXPIRATION MONAY WAS BULLISH, EXPIRATION DAY WAS BEARISH
According to Stock Trader's Almanac:
- Monday before October expiration, Dow up 24 of 29.
- October expiration day, Dow down 4 straight and 5 of last 6.
For October Seasonality chart please refer to 10/01 Market Recap.
HIGHLIGHTS OF THE OTHER ETFS IN MY PUBLIC CHART LIST
| TREND | COMMENT | |
| QQQQ | UP | 4.1.1 Nasdaq 100 Index (Weekly): NDX to SPX ratio too high. |
| IWM | UP | |
| CHINA | ||
| EMERGING | *UP | 4.1.6 iShares MSCI Emerging Markets (EEM Weekly): EEM to SPX ratio too high. |
| CANADA | UP | TOADV MA(10) too high and has negative divergence. |
| BOND | DOWN | |
| EURO | UP | Bearish Reversal Bar, pullback? |
| GOLD | *UP | Bearish Engulfing, pullback? |
| GDX | *UP | 4.3.1 Market Vectors Gold Miners (GDX Weekly): GDX to SPX ratio too high. 3.2.1 Market Vectors Gold Miners (GDX Daily): Bearish Engulfing, pullback? |
| OIL | *UP | Bearish Engulfing, pullback? |
| ENERGY | UP | |
| FINANCIALS | *UP | 4.4.2 Financials Select Sector SPDR (XLF Weekly): Head and Shoulders Top in the forming? 3.4.0 Financials Select Sector SPDR (XLF Daily): Bearish Engulfing, pullback? |
| REITS | UP | 4.4.3 Real Estate iShares (IYR Weekly): Home builder is lagging. 3.4.1 Real Estate iShares (IYR Daily): Black bar, pullback? |
| MATERIALS | UP |
- Please make sure you understand how to use the table above. The purpose of this report is to provide info so contradictory signals are always presented.
- Conclusions can be confirmed endlessly, but trading wise, you have to take actions at certain risk level as soon as you feel the confirmation is enough. There's no way for me to adapt to different risk levels therefore no specific buy/sell signals will be given in this report except the mechanical signals such as SPY ST Model.
- * = New update.
- Blue Text = Link to a chart in my public chart list.
- LA = Lateral Trend.


