


10/21/2010 8:22:05 AM
No reproduction, retransmission, or other use of the information or images is authorized. Legitimate news media may quote representative passages, in context and with full attribution, for the purpose of reporting on our opinions. Media interested in speaking to Mr. DeVincentis should email jay@stockbarometer.com to arrange a call.
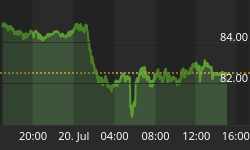
Wednesday's weakness in the dollar supported volatility - what's it mean?
The basic read on the market is that it has gone sideways to slightly higher for the past several days. This builds up potential for a larger move. That move is usually unpredictable. Our job is to weigh the factors and variables and make our best guess for action going forward.
So while our bet is that the market will move lower here, it has the potential to remain in a liquidity thrust, where technical indicators tend not to work.
But it seems pretty clear to everyone in the markets that as the dollar goes, the market goes (just inverse). The dollar had some pretty interesting action overnight, but broke lows. It really all depends on it's response to today's unemployment report. People are expecting it to continue lower - that has me leaning the other way.
As traders, we watch the time frames for pivots during the day. Comparing that time with the price level will give us a potential good trade to the downside - i.e. to reload the bearish bet. To help you navigate the intraday action, we have a chat room that I am in every day. We're also in the process of migrating to PalTalk - this will give you access to my trading screen during the day so we can go over recommendations in more detail. Here's the link to sign up:

The am report is as follows:

I'm always asked to predict what the economic reports are going to say and how the markets are going to react. To be honest, I don't waste much time on this, because it's an exercize in futility. What's important is what the market does and how do we profit from it - and that's pretty easy to see.
There are a couple of reports out at 10. These could play into the intra day action. Join us in the chat room on how to interpret it. I keep an ear to the S&P trading pits and advise the clients in our chat room what big money is doing. It's important to know.
Here's the economic week ahead.

On to the charts:

Stock Barometer Analysis
We remain in Sell Mode, looking for the markets to move lower from now into 10/27.
On Wednesday, we retraced some of Tuesday's action. The market is not ready to go lower. But there can be volatility at highs, as we've seen in the past.
But whenever we get up near highs, things can get dicey, so if necessary, I'll send out an email updating the intra day action and our response.
The Stock Barometer is my proprietary market timing system. The direction, slope and level of the Stock Barometer determine our outlook. For example, if the barometer line is moving down, we are in Sell Mode. A Buy or Sell Signal is triggered when the indicator clearly changes direction. Trend and support can override the barometer signals.
Money Management & Stops
To trade this system, there are a few things you need to know and address to control your risk:
- This system targets intermediate term moves, of which even in the best years, there are usually only up to 7 profitable intermediate term moves. The rest of the year will be consolidating moves where this system will experience small losses and gains that offset each other.
- This system will usually result in losing trades more than 50% of the time, even in our best years. The key is being positioned properly for longer term moves when they come.
- Therefore it is vitally important that you apply some form of money management to protect your capital.
- Trading a leveraged index fund will result in more risk, since you cannot set stops and you cannot get out intraday.
Accordingly;
- Make sure you set your stops so that you can lose no more than 2% per trade (based on the QQQQ if you're trading leveraged funds and options with our trading service).
Potential Cycle Reversal Dates
2010 Potential Reversal Dates: 1/19, 1/28, 3/2, 3/23, 4/7, 5/30, 6/10, 6/28, 7/10, 8/13, 9/7, 10/2, 10/27, 11/21, 12/19. We publish dates up to 2 months in advance.
We are looking for a larger move lower into 10/27.
We've added our two final dates of the year. The important thing to note is that these dates are a month apart, so we could see some wide swings to end out the year - at least in time.
My Additional timing work is based on numerous cycles and has resulted in the above potential reversal dates. These are not to be confused with the barometer signals or cycle times. However, due to their past accuracy I post the dates here.
2009 Published Reversal Dates: 1/20, 2/11, 3/7, 3/15, 4/8, 4/16, 4/27, 5/7, 6/8, 7/2, 7/17, 9/14, 10/10, 10/24, 11/12, 11/30, 12/9, 12/21, 12/29. 2008 Potential Reversal Dates: 12/31, 1/11, 2/1, 2/13, 3/6, 4/5, 4/22, 5/23, 6/6, 6/27, 7/13, 9/2, 10/3, 10/22, 11/10, 12/11. 2007 Potential Reversal Dates: 1/10, 1/14, 1/27, 1/31, 2/3, 2/17, 3/10, 3/24, 4/21, 5/6, 6/15, 8/29, 10/19, 11/29, 12/13, 12/23, 12/31, 1/11/08. 2006 potential reversal dates: 1/16, 1/30, 2/25, 3/19, 4/8, 5/8, 5/19, 6/6(20), 7/24, 8/20, 8/29, 9/15, 10/11, 11/28. 2005 Potential reversal dates: 12/27, 1/25, 2/16, 3/4, 3/14, 3/29, 4/5, 4/19, 5/2, 6/3, 6/10, 7/13, 7/28, 8/12, 8/30-31, 9/22, 10/4, 11/15, 11/20, 12/16.
Spread Indicators
Use the following spread/momentum indicators to assist in your trading of the QQQQ, GLD, USD, USO and TLT. They are tuned to deliver signals in line with the Stock Barometer and we use them only in determining our overall outlook for the market and for pinpointing market reversals. The level, direction, and position to the zero line are keys in these indicators. For example, direction determines mode and a buy signal 'above zero' is more bullish than a buy signal 'below zero'.
QQQQ Spread Indicator (NASDAQ:QQQQ)

The QQQQ Spread Indicator will yield its own buy and sell signals that may be different from the Stock Barometer. It's meant to give us an idea of the next turn in the market.
Gold Spread Indicator (AMEX:GLD)

Want to trade Gold? Use our signals with the Gold ETF AMEX:GLD. Gold gives us a general gage to the overall health of the US Economy and the markets.
US Dollar Index Spread Indicator (INDEX:DXY)

Want to trade the US Dollar? Use our signals with the Power Shares AMEX:UUP: US Dollar Index Bullish Fund and AMEX:UDN: US Dollar Index Bearish Fund.
Bonds Spread Indicator (AMEX:TLT)

Want to trade Bonds? Use our signals with Lehman?s 20 year ETF AMEX:TLT. The direction of bonds has an impact on the stock market. Normally, as bonds go down, stocks will go up and as bonds go up, stocks will go down.
OIL Spread Indicator (AMEX:USO)

Want to trade OIL? Use our signals with AMEX:USO, the OIL ETF. We look at the price of oil as its level and direction has an impact on the stock market.
Supporting Secondary Indicator

We daily monitor hundreds of popular and proprietary technical indicators that break down market internals, sentiment and money flow to give us unique insight into the market. We feature at least one here each day in support of our current outlook.
Summary of Daily Outlook
We remain in Sell Mode, looking for a larger move lower into 10/27.
The market is hypersensative to the action in the dollar here. Bonds have also taken a back seat, although they've been rallying. If bonds continue higher, and the dollar holds these lows, the market should move lower.
The chart above shows what I call the "Smart Money". It suggests the smart money is positioning for a move lower.
For my clients who trade intra day - here are the indices pivots for today's trade.

I also post these in the chat room every morning. Join me in the chat room if you want to see how do I use them. We publish chart of the ES and Qs with pivots.
Here's a deeper look at the S&P Futures - these levels are very important if you're going to day trade the market.

These levels can be important for both day traders and investors. How? Well, if you are going to take a stock position, it's always best to get the most efficient entry. Understanding that there are key pivots during the day and key levels that futures traders look for, will help you figure a better entry price (instead of just buying at the open). Combine these levels with the timing of the economic reports on the list at the top of the page, and you can really catch some nice swings in the market. More efficient trade entry increases your relative profit per trade.
If you have any questions or comments, email me at Jay@stockbarometer.com.
Regards,


