


Market Wrap
Week Ending 10/22/10
The Dollar
Most markets are keying off the dollar. Since June, the dollar has fallen precipitously, from a high of 88.78, to the recent low of 76.14, a loss of over 14%. This has placed a strong bid under stocks, commodities, and precious metals, as the chart below shows.
As mentioned in the mid-week update, the dollar is trying to carve out a short term bottom, with last week's low of 76.14 holding so far. Volatility still reigns supreme, as evidenced by Tuesday's huge gap up, followed by Wednesday's gap down; which wiped out most of the prior days gain.
This weekend the G-20 meetings will discuss the use of foreign exchange rates to devalue currencies to bolster exports and trade growth. The U.S. wants to impose current account targets, but I find it hard to believe such actions will be taken. In fact, I suspect that not much will come out of the meeting except a lot of jawboning. Just as all world currencies are mere promises to pay - there will be more promises than actions. What is needed is a return to honest money of gold and silver coin. Still, it is possible that something is said that sets the currency markets in turmoil.

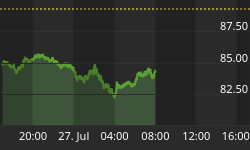
For the week the dollar closed up .55% at 77.46. The level to watch is the low at 76.14. If this level holds, then the dollar may rally further. The daily chart below shows a positive MACD crossover, which suggests more upside to come.
A further rally in the dollar will put pressure on stocks, commodities, and gold. The precious metals have already felt the heat, with gold dropping 3% and silver 4%. This was not unexpected, as both metals were overbought and ripe for a pullback.

Overlaid on the chart above are two sets of Fibonacci retracements levels: the first set (blue lines) expands down from the June high at 88.71, to the Oct. low at 76.14 - the level to watch. The second set (black lines) connects the Sept. high at 83.59, with the Oct. low.
The dollar's first upside target is the 38.2% retracement level at 78.99. Just above is the 50% Fib retracement at 79.87. Notice that right around 80 both sets of Fib levels (blue & black) begin to overlap one another. These areas often represent significant retracement zones and are worth keeping an eye on. If the dollar were to rally back to 80, there will be significant pressure placed on stocks and commodities. The operable word being: if. The important point is that the direction of the dollar, be it up or down, will affect other markets. Thus the dollar bears close watching.
A second key to the stock market's direction may reside with the financials. The daily chart of XLF below shows why. So far, the financials have been underperforming the overall market. They have not been able to get back to near their June high (15).
If the financials cannot break above resistance, they could drag the market down. Conversely, if they can break out above 15, they would give the overall market a boost.

Gold
Gold fell $40.50, closing at $1328.10, for a weekly loss of 3%. Gold has been overbought for months, and was due for a correction. MACD has put in a negative crossover, although it still remains in positive territory.
Everyone has known that gold's overbought condition was setting it up for the inevitable correction. It should be of no surprise. The $64 dollar question is: at what price is adding to positions viable.
Gold is the only secular bull market existent; and in bull markets buying weakness that holds support, offers the best risk to reward opportunities. The model portfolio's core positions remain 60% in a combination of gold, silver, and precious metal stocks (detailed allocation for subscribers). Short term trading positions were exited two weeks ago and we are looking to establish new positions once a bottom is in. On the chart below, the first Fib support level is at $1299.00.

Gold has been so strong that its 38.2% Fib level may well provide support, which would amount to a 6% correction. Since August gold had risen about 20%, so this would not be a major pullback.
The direction and strength of the dollar will be one of the determining factors on just how far gold corrects. A stronger dollar will put more pressure on gold, while a weaker dollar will put a bid under gold.
The next chart shows that gold could fall back to its 150 day moving average at $1221.00; and if recent history is any guide, it would represent a buying opportunity.
This is not too say that gold will drop this far, but it might. The bigger issue is being able to step up to the plate if the opportunity arises. A drop to the 150 dma would shake a lot of weak hands out of the market.

Notice on the weekly chart that lower trendline support comes in around $1240.00, very close to the above 150 dma (1221). Also note that gold has been so strong that it hasn't (yet) broken below the 80 stochastic level, although RSI has dipped below 70 (66.94).

Gold Stocks
The precious metal stocks (GDX) took a hit of just over 4% for the week. As the chart below shows, they were overbought and due for a correction. Since August the GDX had gained almost 25%.
Price is presently testing its first Fib retracement level near 54. Both the CCI indicator at the top of the chart; and the stochastic indicator at the bottom of the chart are entering oversold territory.
The vertical blue dotted lines connect similar set-ups that have led to past rallies in the past. However, the gold stocks will not bottom until gold does. Note that in July, STO dipped below the 20 zone three times before the rally started in August.

Summary
Watch the dollar. If the dollar rallies - stocks, commodities, and the precious metals will come under pressure. If the dollar breaks support at 76.14, then all hell could break lose in the currency markets; and gold, stocks and commodities would have a strong bid placed under them.
Essentially, a break of the dollar would mean just that: the dollar would be falling apart. A serious currency crisis could develop. Gold would react strongly to the upside.
Some of the gold stocks are entering oversold territory and starting to look interesting, but we don't want to jump the gun before knowing that gold has bottomed.
Recently, I have received a few emails asking about investing in the GDX versus individual gold stocks versus the juniors versus physical holdings, etc. As long term subscribers know, the portfolio has been over weighted in physical gold and silver, as they are the safest positions for core holdings.
Major and select mid-tier gold and silver producers are preferred for that portion of the portfolio allocated to pm stocks; and only those few that are performing the best at any given time. Until the most recent rally, very few producers had bettered their 2006 highs. With the recent rally, several have forged to new all-time highs.
However, the GDX presently has a promising chart formation developing, especially considering its recent correction from overbought levels. Its chart shows more potential than most of the major producers, as a possible cup and handle formation could be developing. It will depend on whether support here holds or not.
Below is a chart of Randgold Resources that has been a main stay in the portfolio for years; and has far outperformed physical gold and silver and most pm stocks as well. Individual stock selection utilizing chart formations is a major component in structuring a portfolio.

The precious metals and other markets are at crucial inflection points, with gold coming off recent all-time highs. The direction of the dollar will have huge repercussions on all markets.
Presently, the world is awash in a sea of debt, which spawns all borders and sectors: national and international: public, private, and commercial. How will this play out going forward? Is the global recovery back on track or off course? Are investors flocking to the risk on trade, or to the risk off trade? Which investments will benefit?
If you would like to read a comprehensive report that covers all these subjects and more, we invite you to try a three month trial subscription to the Honest Money Gold & Silver Report.
Our stock watch list provides numerous investment ideas and the model portfolio offers a game plan to implement them. Your subscription includes a detailed monthly report, with dozens of charts; a mid-week update; and a weekend summary. No more than two days of market action goes by without commentary. There is no obligation to continue your subscription and the free book and other materials are yours to keep. Stop by and check it out.
Good Luck. Good Trading. Good Health. And that's a Wrap.

Come Visit Our Website: Honest Money Gold & Silver Report
New Book Now Available- Honest Money


