

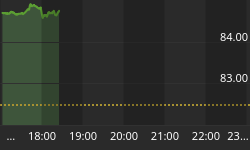


On today's chart, we will show the daily C-RSI trending (zero based, Relative Strength trending of each index).
This chart shows the New York Stock Exchange index, the NASDAQ 100, the S&P 500, and the Institutional index on the top half. On the bottom half, it shows the Volatility Indexes for the S&P and the NASDAQ 100.
Observations:
1. Observe the top half of the chart for a moment and see what you can observe. One thing that stands out, is that the Strength for the NASDAQ 100 is the only index rising while the other three indexes are showing falling strength. That means the other three indexes are negatively divergent to the NASDAQ 100.
2. While the NASDAQ 100's rising C-RSI looks like a positive occurrence, it's Volatility Index is negatively divergent and falling.
- So, the market is saying that conditions are out of balance and need to be rebalanced. While we can see that there are negative divergences, all of the C-RSIs are still in positive territory.
What happens now will be directly related to what happens to "inflowing Liquidity".
We didn't post the Liquidity chart on this free site today, in respect for our paid subscribers. But, we can tell you this ... inflowing Liquidity is positive and was rising until two weeks ago. Since that time, the Liquidity flows have been moving sideways, inside a triangular formation.
What's newsworthy now, is that the inflowing Liquidity will reach its apex before the end of today and have a breakout. Isn't it quite interesting that the this important event is happening on "election day"?
(A comment on the importance of inflowing/outflowing Liquidity levels. Many are baffled by negative divergences coming from data or indicators that never seem to kick-in. The reason for this, is that "negative divergences" never kick-in until inflowing Liquidity stops rising and goes into an outflow condition.)


