11/16/2010 9:12:11 AM
The markets open higher but confidence is lacking...
Recommendation:
Take no action.
Daily Trend Indications:

- Positions indicated as Green are Long positions and those indicated as Red are short positions.
- The State of the Market is used to determine how you should trade. A trending market can ignore support and resistance levels and maintain its direction longer than most traders think it will.
- The BIAS is used to determine how aggressive or defensive you should be with a position. If the BIAS is Bullish but the market is in a Trading state, you might enter a short trade to take advantage of a reversal off of resistance. The BIAS tells you to exit that trade on "weaker" signals than you might otherwise trade on as the market is predisposed to move in the direction of BIAS.
- At Risk is generally neutral represented by "-". When it is "Bullish" or "Bearish" it warns of a potential change in the BIAS.
- The Moving Averages are noted as they are important signposts used by the Chartists community in determining the relative health of the markets.
Current ETF positions are:
In cash.
Daily Trading Action
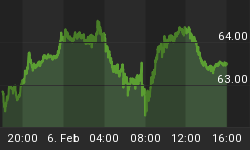
The major index ETFs opened higher and maintained that level or rose for the first fifteen minutes of trade before reversing to move lower for the next half hour, closing the opening gap on the S&P-500 and nearly so on the Dow. The NASDAQ-100 made a more significant dive before recovering to move higher until around 2:00pm, like the Dow and S&P-500. From 2:00pm, a slide began that looked like the see-saw action seen during the rest of the day that saw the markets continue to press higher but that move never reversed and selling accelerated into the close leaving the NASDAQ-100 and S&P-500 with fractional losses and the Dow finishing up slightly. The Semiconductor Index (SOX 379.57 -3.04) finished fractionally lower while the Russell-2000 (IWM 72.04 +0.01) was flat. The bank indexes countered the moves lower by most of the market with the Bank Index (KBE 23.51 +0.16) and the Regional Bank Index (KRE 23.50 +0.16) both recording fractional gains. The 20+ Yr Bonds (TLT 93.81 -2.00) fell more than two percent. NYSE volume was light with 877M shares traded. NASDAQ volume was below average with 1.860B shares traded.
There were four economic reports of interest released:
- Retail Sales (Oct) rose +1.2% versus an expected +0.7% rise
- Retail Sales excluding Autos (Oct) rose +0.4% as expectec
- Empire Manufacturing Index (Nov) fell to -11.14 versus an expected reading of +11.7
- Business Inventories (Sep) rose +0.9% as expected
The first three reports were released an hour before the open while the lastreport came out a half hour after the open. The Empire Manufacturing report was actually quite shocking but the market seemed to ignore it on release.
The U.S. dollar broke through resistance closing at its highest level since the end of September. This move by the dollar pressured equities and will continue to do so if the dollar continues to rise.
M&A news over the weekend spurred interest in equities which explained the gap up open.
Financials (+0.4%), Telecom (+0.3%), Utilities (_0.3%), and Industrials (+0.2%) moved higher on the day while six out of ten economic sectors in the S&P-500 finished lower led by Materials (-0.9%).
Implied volatility for the S&P-500 (VIX 20.20 -0.41) fell two percent and the implied volatility for the NASDAQ-100 (VXN 21.69 -0.86) fell four percent.
The yield for the 10-year note fell nineteen basis points to close at 2.57. The price of the near term futures contract for a barrel of crude oil rose forty-two cents to close at $84.86.
Market internals were mixed with decliners leading advancers 9:8 on the NYSE while advancers led decliners 6:5 on the NASDAQ. Up volume led down volume by three percent on the NYSE while down volume led up 3:2 on the NASDAQ. The index put/call ratio fell 0.34 to close at 1.20. The equity put/call ratio fell 0.11 to close at 0.56. The incredible complacency of this market is astonishing, given the lower close for the major indexes (except for the Dow) and put/call ratios actually fell.
Commentary:
Monday's mixed finish suggests bulls and bears are evenly matched here. The dollar is the key here with a continued move higher for the greenback putting pressure on equities. Tuesday's session for equities resulted in a 4% move lower for Shanghai stocks as well as a move lower by European boarsed (well at the time of this writing at any rate). This is pressuring on U.S. equities futures.
We are currently in cash waiting for the market to signal a direction. While the market has been due for a correction and the uptrend is currently threatened, it has not yet been broken. A breakdown in the current surge for the dollar may embolden equity bulls to step forward yet. Light trading volume signals a lack of conviction at this time.
We hope you have enjoyed this edition of the McMillan portfolio. You may send comments to mark@stockbarometer.com.


