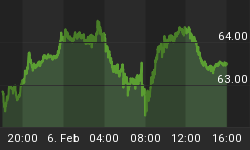
In the very short-term, risk assets have negative alignment of the fundamentals and technicals. Concerns about excessive debt in Ireland seem to be moving toward a band-aid resolution, but the market could turn its attention to Spain or Portugal in short order. From a technical perspective, we have short-term MACD sell signals on the daily charts of the S&P 500, gold, silver, copper, and the euro. We have short-term MACD buy signals on the daily charts of the U.S. dollar and the VIX. There is very little conviction behind the move in the VIX, which means risk assets could still surprise on the upside, especially if the S&P 500 can hold above 1,195 on a closing basis. If we see a close below 1,195, the chart below shows some areas to watch on the downside.

The early caution flags for the current pullbacks in stocks, precious metals, and commodities came from the currency markets. In the October 11th post, U.S. Dollar Could Rally in Coming Weeks, we outlined concerns about record negative sentiment toward the greenback. We were also concerned about support levels relatively close by for the dollar. The dollar has now rallied over 4% from its November low, putting downward pressure on stocks, gold, silver, and copper.
On November 9th, in the Dollar, Euro, Gold, Silver, and the VIX are Poised for Reversals, we outlined numerous concerns related to the elevated odds of short-to-intermediate term reversal of the "risk-on" trade. The elements remain in place for a market correction.
The CCM Bull Market Sustainability Index (BMSI) has not made a new high since Monday. More importantly, the CCM 80-20 Correction Index has not made a new high since October 8, 2010. Both occurrences are indicative of a weakening market - both have raised yellow flags for the bulls. Our concerns outlined on November 4th in Debt Concerns Could Dampen Inflation Trade still apply. We believe the Fed's quantitative easing program (analysis) will help push asset prices higher (QE investing resources) in the intermediate-term, which may occur after a correction of 3% to 5% from the recent peak in the S&P 500.


