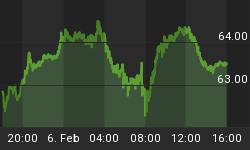
Since November 3, after the announcement of QE2, the bond market and the dollar have reversed their powerful megatrends, which could have implications for gold.
The bond market went straight up from April into November, from about 115 to 128, while 10-year rates went from about 4% to the November 3 low of 2.3%. Since that time, price has come down to Monday's low of 124.15 and yield to around 2.9%, with the decline in price breaking the series of higher highs and higher lows and breaking below the prior pivot point. This has come right as the Fed last Friday implemented the first traunch of QE2 buying of longer-term paper.
So the bond market has put in an important topping process, and appears to be resting, deservedly so. Next support in December T-notes is 124, not far from where it hit today, which would represent about 3.03-0.5% in yield.
At the same time, the dollar, whose chart you can see runs inverse to bonds (as rising interest rates make the dollar more attractive), is rallying after being in a significant down-channel since June. The dollar is approaching the top trend line of this channel at around 79.20-.30, a break through which could accelerate the upmove.
In our video we discuss this in more detail, but one major impact is that a rising dollar and rising rates in general are negatives for the commodity sector, in particular gold.
The commodity side of gold, represented by the SPDR Gold Shares (GLD), is most vulnerable, as it appears from the charts. The long-term up-channel has taken the GLD from 93 in June 2009 to a peak of 139.15 on November 9. However, the peak in momentum occurred on October 14 at 134.85. While price paused after that before rocketing to the November 9 highs, the giant momentum non-confirmation was and still is a warning sign that the GLD is vulnerable to a major shakeout.
The GLD declined from last week's high at 139.15 to Monday's low of 132.40, and closed Monday's session leaning against the bottom trendline of the channel. If that breaks, there's a gap that needs to be filled down to 129.70-129.50, with the 50 DMA at 129.70. If that key support zone breaks, the GLD could traverse towards the bottom of the major channel down to 123-124, which also happens to be the high of the Feb-June rally (prior resistance and now support).
The GLD is even more vulnerable to a shakeout given the changing trend in bonds and the dollar. This is due to the fact that if the dollar would have a reason to take off, there would certainly be some exodus out of gold.
As for gold stocks, like superstar Freeport-McMoran Copper & Gold (FCX), they would be vulnerable, too, but have more resilience due to the strength of the stock market. However, the FCX chart shows that, like with the GLD, momentum peaked before price did. If this non-confirmation and negative divergence weigh on the price chart, then keep an eye on key support at 90-88. A break through that could take FCX towards the 200 DMA, which is coiling up towards 80.
A better play would be the Market Vectors Gold Miners ETF (GDX). While the GDX is leaning against key support at 59, and could possibly could gap down from its "island cluster" and test the trendline created off the Jul-Nov channel in the vicinity of 55 1/2 to 55, I would expect the next move from there to be up. For one thing, momentum has moved in step with price, unlike with the GLD and FCX. For another, the GDX offers more safety due to the diversification of names.
For more of Mike Paulenoff, sign up for a Free 15-Day Trial to his ETF Trading Diary.


