


11/18/2010 8:07:48 AM
No reproduction, retransmission, or other use of the information or images is authorized. Legitimate news media may quote representative passages, in context and with full attribution, for the purpose of reporting on our opinions. Media interested in speaking to Mr. DeVincentis should email jay@stockbarometer.com to arrange a call.
We've been waiting for it, and it's finally here. Join us today if you want to play it!
Good Morning - here is a complimentary version of Jay DeVincentis' Daily Stock Barometer. There's a lot going on in the markets today. And I invite you to join us in our chat room. The password is barometer8. Access is open for the rest of this week. If you would like to start receiving this article on a daily basis, click here.
We're also starting to offer training. Click here to see our courses and our upcoming scheduled events.
There is so much going on in the markets today - that I woke up at 4am to start trying to put it all in perspective. Today is such a critical day in the markets, that you'll definitely want to join us in the chat room today if you can. Here's what's going on:
1) The dollar weakness - this has caused the markets to lift and the dollar has pulled back to a critical level. The market will gap to this level.
2) Our next key reversal date is 11/21 - if the market bounces up into this date, then I expect it to mark a top.
3) The GM IPO - big events like this often occur near significant tops.
4) Options Expiration - is this Friday and expirations often lead to reversals.
5) The Fed's bond purchase program through POMO is just getting started. Conventional wisdom suggests bonds should rally. But they've had trouble. Maybe there's a bigger seller out there than the Fed is a buyer (can you say China)? Asia trying to slow growth and the last time the Fed was buying bonds, the dollar tanked. So if a large holder in US Bonds were to sell while the Fed is buying, that would support the dollar, which supports Asia's objectives. This is currency wars on steriods.
And the list goes on...
On the economic front here, we have some data out at 8:30 am and a Philly Fed report at 10am. I think the market could hold the gap up into the 10am period - and then weakness may settle in.

As for the week ahead, here's what we have on the economic front: Note, there are no reports on Friday, but Bernanke does speak.

This morning we have the GM IPO - It's been priced around 33. Join us in the chat room as we watch it come out.
To help you navigate the intraday action, we have a LIVE chat room that I am in every day. We run it on PalTalk. This will allow you to hear me, and chat with others. Upgrading will also give you access to my trading screen during the day so we can go over recommendations in more detail. Here's the link to sign up:

On to the charts:

Stock Barometer Analysis
The barometer remains in Sell Mode, we see the markets moving lower into 11/21 at which point we'll reevaluate our position.
That's this Sunday - and these dates have an accuracy of +/- 2 days. So we're approaching a window for a reversal, so what happens here is very critical for the markets direction for the next few weeks.
The Stock Barometer is my proprietary market timing system. The direction, slope and level of the Stock Barometer determine our outlook. For example, if the barometer line is moving down, we are in Sell Mode. A Buy or Sell Signal is triggered when the indicator clearly changes direction. Trend and support can override the barometer signals.
Money Management & Stops
To trade this system, there are a few things you need to know and address to control your risk:
- This system targets intermediate term moves, of which even in the best years, there are usually only up to 7 profitable intermediate term moves. The rest of the year will be consolidating moves where this system will experience small losses and gains that offset each other.
- This system will usually result in losing trades more than 50% of the time, even in our best years. The key is being positioned properly for longer term moves when they come.
- Therefore it is vitally important that you apply some form of money management to protect your capital.
- Trading a leveraged index fund will result in more risk, since you cannot set stops and you cannot get out intraday.
Accordingly;
- Make sure you set your stops so that you can lose no more than 2% per trade (based on the QQQQ if you're trading leveraged funds and options with our trading service).
Potential Cycle Reversal Dates
2010 Potential Reversal Dates: 1/19, 1/28, 3/2, 3/23, 4/7, 5/30, 6/10, 6/28, 7/10, 8/13, 9/7, 10/2, 10/27, 11/21, 12/19. We publish dates up to 2 months in advance.
We see the market moving lower into 11/21. At that point, we'll reevaluate the movement into 12/19.
My Additional timing work is based on numerous cycles and has resulted in the above potential reversal dates. These are not to be confused with the barometer signals or cycle times. However, due to their past accuracy I post the dates here.
2009 Published Reversal Dates: 1/20, 2/11, 3/7, 3/15, 4/8, 4/16, 4/27, 5/7, 6/8, 7/2, 7/17, 9/14, 10/10, 10/24, 11/12, 11/30, 12/9, 12/21, 12/29. 2008 Potential Reversal Dates: 12/31, 1/11, 2/1, 2/13, 3/6, 4/5, 4/22, 5/23, 6/6, 6/27, 7/13, 9/2, 10/3, 10/22, 11/10, 12/11. 2007 Potential Reversal Dates: 1/10, 1/14, 1/27, 1/31, 2/3, 2/17, 3/10, 3/24, 4/21, 5/6, 6/15, 8/29, 10/19, 11/29, 12/13, 12/23, 12/31, 1/11/08. 2006 potential reversal dates: 1/16, 1/30, 2/25, 3/19, 4/8, 5/8, 5/19, 6/6(20), 7/24, 8/20, 8/29, 9/15, 10/11, 11/28. 2005 Potential reversal dates: 12/27, 1/25, 2/16, 3/4, 3/14, 3/29, 4/5, 4/19, 5/2, 6/3, 6/10, 7/13, 7/28, 8/12, 8/30-31, 9/22, 10/4, 11/15, 11/20, 12/16.
Spread Indicators
Use the following spread/momentum indicators to assist in your trading of the QQQQ, GLD, USD, USO and TLT. They are tuned to deliver signals in line with the Stock Barometer and we use them only in determining our overall outlook for the market and for pinpointing market reversals. The level, direction, and position to the zero line are keys in these indicators. For example, direction determines mode and a buy signal 'above zero' is more bullish than a buy signal 'below zero'.
QQQQ Spread Indicator (NASDAQ:QQQQ)

The QQQQ Spread Indicator will yield its own buy and sell signals that may be different from the Stock Barometer. It's meant to give us an idea of the next turn in the market.
Gold Spread Indicator (AMEX:GLD)

Want to trade Gold? Use our signals with the Gold ETF AMEX:GLD. Gold gives us a general gage to the overall health of the US Economy and the markets.
US Dollar Index Spread Indicator (INDEX:DXY)

Want to trade the US Dollar? Use our signals with the Power Shares AMEX:UUP: US Dollar Index Bullish Fund and AMEX:UDN: US Dollar Index Bearish Fund.
Bonds Spread Indicator (AMEX:TLT)

Want to trade Bonds? Use our signals with Lehman?s 20 year ETF AMEX:TLT. The direction of bonds has an impact on the stock market. Normally, as bonds go down, stocks will go up and as bonds go up, stocks will go down.
OIL Spread Indicator (AMEX:USO)

Want to trade OIL? Use our signals with AMEX:USO, the OIL ETF. We look at the price of oil as its level and direction has an impact on the stock market.
Supporting Secondary Indicator

We daily monitor hundreds of popular and proprietary technical indicators that break down market internals, sentiment and money flow to give us unique insight into the market. We feature at least one here each day in support of our current outlook. As an annual subscriber to any of our services, you will get access to all our charts and research.
Summary of Daily Outlook
We remain in Sell Mode, looking for a larger move lower into 11/21, quite possibly into 12/19.
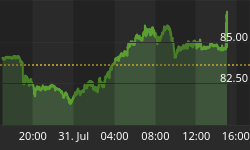
The markets are set to gap up this morning. Strength has been moving from the Asian Markets, to the European Markets and should translate and follow through to our markets regardless of this morning's economic release at 8:30.

In this view of the global markets, you can see that the Asian markets are closed. The European markets close at 11:30am EST for us, which is one reason why the 11:30am time pivot is important to monitor.
The key for today is if the markets will be able to hold on to the gains. We have a key reversal date coming up on this Sunday. To me it's clear, if the markets can't hold on to this morning's gap, and push lower and possibly break lows, then we should set up a short term low and a larger bounce. However, if the markets hold onto the gains today, they will likely trade slightly higher over the next few days and set up a larger leg lower in the market.
Here's another view of the events for the day - they will play into our intra day strategies:

For my clients who trade intra day - here are the indices pivots for today's trade.

I publish charts of the ES and Qs with pivots in the chat room every morning. Join me in the chat room if you want to see them, and learn how to use them.
Here's a deeper look at the S&P Futures - these levels are very important if you're going to day trade the market.

These levels are important for both day traders and investors. How? Well, if you are going to take a stock position, it's always best to get the most efficient entry. Understanding that there are key pivots during the day and key levels that futures traders look for, will help you figure a better entry price (instead of just buying at the open). Combine these levels with the timing of the economic reports on the list at the top of the page, and you can really catch some nice swings in the market. More efficient trade entry increases your relative profit per trade.
And finally, here's a view of our 35-day trading cycle:

We are in a sell cycle (based on this cycle).
Looking at our 10/20/40 week cycles above which we combine with seasonality, you can see the markets could bounce today and over the next couple of days into a seasonally weak period. So how the markets sets up today and into tomorrow will set up our call for the next few weeks.
Truly a historic time to be following the markets closely.
If you have any questions or comments, email me at Jay@stockbarometer.com.
Regards,


