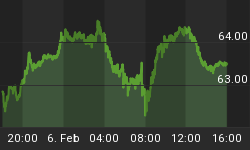
Last Friday, we posted this NYA Index chart showing how it was on the cusp of breaking down into a correction.
It has been touch and go during the week as the index tested its 7471 and 7478 support levels. Wednesday was a reprieve when the index bounced up from the supports and closed higher.
But, the market is not "out of trouble" yet. Take a look at the blue arrows and see what has been happening. The closing highs have been moving lower since November 5th, and that has to change or the market will fall below support levels and go into correction.
So, we are not out of the woods yet, and investors should keep an eye on these important NYA index support levels next week.


