11/30/2010 9:13:57 AM
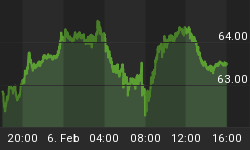
The bears thought they had the bulls on the run and then the ambush occured...
Recommendation:
Take no action.
Daily Trend Indications:

- Positions indicated as Green are Long positions and those indicated as Red are short positions.
- The State of the Market is used to determine how you should trade. A trending market can ignore support and resistance levels and maintain its direction longer than most traders think it will.
- The BIAS is used to determine how aggressive or defensive you should be with a position. If the BIAS is Bullish but the market is in a Trading state, you might enter a short trade to take advantage of a reversal off of resistance. The BIAS tells you to exit that trade on "weaker" signals than you might otherwise trade on as the market is predisposed to move in the direction of BIAS.
- At Risk is generally neutral represented by "-". When it is "Bullish" or "Bearish" it warns of a potential change in the BIAS.
- The Moving Averages are noted as they are important signposts used by the Chartists community in determining the relative health of the markets.
Current ETF positions are:
In cash.
Daily Trading Action
The major index ETFs opened lower and moved up in the first few minutes of trading such that the NASDAQ-100 ETF (QQQQ) was able to close the gap, but the S&P-500 ETF (SPY) and the Dow ETF (DIA) came up short when the major indexes fell off a cliff and began a steep descent. The major indexes found an intraday bottom a half hour later and bounced modestly to trade in a see-saw path modestly higher until around 2:00pam when the bulls hit back hard and drove the major indexes back into positive territory before the major indexes sold off modestly in the final half hour of trading, leaving the Dow and S&P-500 close to flat but with the NASDAQ-100 off about 0.4%. The major index ETFs finished higher except for QQQQ which finished down four cents. The Semiconductor Index (SOX 395.15 -0.88) closed modestly lower while the Russell-2000 (IWM 73.33 +0.11) posted a fractional gain. The bank indexes moved lower with the Bank Index (KBE 22.41 +0.26) gained more that one percent with the Regional Bank Index (KRE 22.83 +0.23) posting a one percent gain even. The 20+ Yr Bonds (TLT 97.90 +0.83) posted a gain of nearly one percent and closing above its 20-Day Moving Average (DMA) and its 200-DMA. NYSE volume was light with 924M shares traded. NASDAQ volume was light with 1.687B shares traded.
There were no economic reports of interest released.
The U.S. dollar (+0.6%) continues to add to gains and closed above the uptrend line which has served as resistance. Translation, the dollar has broken out and is preparing to walk up the upper Bollinger Band. The 200-DMA lies just two percent higher which should prove to be formidable resistance which is likely where equities begin to take off to the upside. There is another key resistance level just 0.8% higher which could stall the rally as well.
Implied volatility for the S&P-500 (VIX 21.53 -0.69) fell three percent while the implied volatility for the NASDAQ-100 (VXN 23.28 +2.56) rose twelve percent.
The yield for the 10-year note fell four basis points to close at 2.82. The price of the near term futures contract for a barrel of crude oil rose $1.97 to close at $85.73.
Market internals were negative with decliners leading advancers 7:5 on the NYSE and by 6:5 on the NASDAQ. Down volume led up volume be several percent on the NYSE and by nearly 3:2 on the NASDAQ. The index put/call ratio rose 0.37 to close at 1.41. The equity put/call ratio rose 0.05 to close at 0.71.
Commentary:
It is worth mentioning again that the anomalies seen after the close of equities exchanges last Friday affected index ETF prices. The artificially depressed prices were off as much as one half of one percent from the major index closes themselves and that anomaly was corrected in Monday's session.
Monday's trading was really all about the U.S. dollar's continued move higher. When the dollar eased after the higher open, this allowed the equities bulls to step in and buy the major indexes. However, a continued move higher for the U.S. dollar will continue to enable the bears as we suggested earlier. We are looking for this move up in the U.S. dollar to falter soon, which should enable a rally for equities, which is when we could move out of cash into long positions. Until then, sit in cash and keep your powder dry.
We hope you have enjoyed this edition of the McMillan portfolio. You may send comments to mark@stockbarometer.com.


