


By Nu Yu with Lorimer Wilson
November 26, 2010
All is not necessarily as it seems when technical analysis is used to determine the anticipated direction of the U.S. Dollar Index, gold and the U.S. and Chinese stock markets. One sector is going up when all the talk is about its demise, another sector is muddling along when all the talk is about its dramatic future prospects and the other sectors have their share of surprises too. Let us take a look at what the charts tell us.
U.S. Dollar Direction: Rebound Continues
As accurately predicted in our Nov.14th article the U.S. dollar had a magical bullish reversal in direction in early November when the anti-dollar crowd sentiment went too far towards the extreme when the Fed's QE2 program was announced and then strengthened on euro zone debt jitters and Korean tension. The dollar's change in direction caught our attention for a third straight week as it developed two major bullish patterns: 1) broadening descending right-triangle pattern, and 2) measured move up pattern.
1. Broadening Descending Right-Triangle Pattern (Bullish Reversal in Direction)
Since the beginning of October the U.S. Dollar Index has formed a 6-week Broadening Descending Right-Triangle Pattern bounded by an upper horizontal line and a lower downtrend line as shown in the chart below. This pattern, a megaphone shape with starting narrow fluctuations and then widening out between diverging boundary lines, usually acts as a bullish direction reversal in a mature downtrend. The height of this pattern suggests that the USD Index has an upside target at 81 which it should reach soon.
2. Measured Move Up Pattern (Continuing Bullish Direction)
For the last three weeks the U.S. Dollar Index has been developing a Measured Move Up Pattern that consists of three parts: 1) a reversal advance, 2) a pullback, and 3) a continuation advance as shown in the following chart. This chart pattern typically begins when prices bottom out after a downtrend. The initial reversal advance in direction acts as a lead-in move to form the first up-leg of the pattern. After a brief pullback in direction ends the second up-leg could be projected at the same angle and length as the first up-leg which gives the optimum price target and maximum anticipated time to reach the target. For the ongoing Measured Move Up Pattern of the dollar index, the current continuation direction advance of the USD Index should reach 82 by early December.
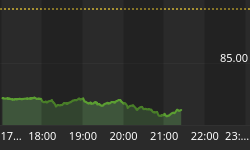
Under pressure from dollar strengthening the direction of both gold and the stock markets has gone nowhere but sideways. However, with the Irish bailout deal and U.S. Navy joint exercise in the Yellow Sea with the South Koreans, we could well see some effect on the direction of the U.S. dollar, gold and the stock markets this week.

Stock Market Direction: Going Sideways
The Dow Jones Wilshire 5000 index, as an average or a benchmark of the total equity market, has been in a five-week horizontal channel with both the trend and momentum indicators showing negative weakness. The market's direction is currently is in the choppy zone of the horizontal channel. The Leading Wave Index (LWX) indicator, color coded in the price bars of the following daily chart of the Wilshire 5000 index, turned neutral last Friday going to 0.8 from -2.4 the previous Friday and suggests that the direction of the U.S. stock market is in a bearish time window that could last weeks until higher market volatility is released.

Broad Market Volatility Direction: Below Panic Threshold Level
The Broad Market Volatility (BIX), measured from over 8000 U.S. stocks, is plotted in the following chart as compared with the Wilshire 5000 index. It closed at 6 on Friday which is still well below the panic threshold level of 46 and indicates that the current market direction is bullish.

Index and Sector Performance Direction: Varied
A look at the direction of the major market indices against the 89-day exponential moving average (EMA89) shows that:
- The Dow Jones Wilshire 5000 index, as a benchmark of the total market, is up 3.82%,
- The Russell 2000 (small cap companies) index is leading the way up 6.92%,
- The S&P 400 (mid-cap companies) index is up 6.56% and
- The Nasdaq 100 (up 6.43%) all of which are outperforming the market's direction as a whole while
- The large-cap S&P 500 index is up only 2.91% and
- The Dow 30 index is up only 2.1%.
- Outperforming sectors are Internet (+12.32%), Semiconductors (+9.88%), and Energy (+6.97%).
- Underperforming sectors are Banks (-4.02%), Pharmaceuticals (-1.50%), and Financials (-0.93%).
Chinese Stock Market Direction: Testing 17-Week Moving Average
The chart below is of China's Shanghai Stock Exchange Composite Index (SSEC). The index retreated after China reported higher-than-expected inflation and renewing concerns that the China's central bank will raise interest rates again. Currently, the SSEC is testing the 17-week moving average (equivalent to the 89-day moving average) but is still within the upward channel and is projected to reach 4200 by mid-2011 (see details of its ascent - and future descent - here).

Conclusion
The above analyses should help you better understand the relatively short-term direction of each of the various indices, sectors and assets discussed and enable you to better make informed and prudent investment decisions during these turbulent times.
Editor's Note: Don't forget to sign up for the FREE weekly "Top 100 Stock Market, Asset Ratio & Economic Indicators in Review"


