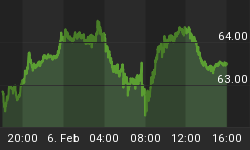
While the S&P500 goes on to test the recent highs, let's make no mistake about it that the last 2 days of positive price action have been predicated on a falling Dollar. Of course, this set of circumstances is no different than the dynamic that has occurred since the March, 2009 lows: that the Dollar and S&P500 have been negatively correlated. A falling Dollar is good for equities and a rising Dollar is a headwind. Ok, nothing new here.
Figure 1 shows that correlation (or lack there of) between the S&P Depository Receipts (symbol: SPY) and the PowerShares DB US Dollar Bull (symbol: UPP). The 40 day and 120 day correlations (bottom 2 graphs) show the high degree with which these 2 instruments are un-correlated. Like I said nothing new here.
Figure 1. SPY v. UUP
What can be appreciated is that I remain bullish on the Dollar Index, and the weakness seen over the past several days was to be expected. As I stated in an article on November 11, I had expected UUP to run into resistance in the $23.40 area. UUP's high for this swing was 23.52 - good enough for government work!! See figure 2 for a daily chart of the UUP.
Figure 2. UUP/ daily
To me the current pullback in the UUP is nothing more than a pullback, and with prices on the UUP at the short term rising trend line, I view this as a good buying opportunity. Failure here would cause me to reconsidermy strong dollar/ weak equity trade.
How do I know I will be right? I don't. Nonetheless, the recent(2 day) surge in equities is being confirmed by the lower Dollar; it isnot being confirmed by higher yields. I will have more on this later inthe week.


