1/6/2011 8:53:51 AM
The bears had to sit on their hands as the bulls continued to run. Patience is a virtue...
Recommendation:
Take no action.
Daily Trend Indications:

- Positions indicated as Green are Long positions and those indicated as Red are short positions.
- The State of the Market is used to determine how you should trade. A trending market can ignore support and resistance levels and maintain its direction longer than most traders think it will.
- The BIAS is used to determine how aggressive or defensive you should be with a position. If the BIAS is Bullish but the market is in a Trading state, you might enter a short trade to take advantage of a reversal off of resistance. The BIAS tells you to exit that trade on "weaker" signals than you might otherwise trade on as the market is predisposed to move in the direction of BIAS.
- At Risk is generally neutral represented by "-". When it is "Bullish" or "Bearish" it warns of a potential change in the BIAS.
- The Moving Averages are noted as they are important signposts used by the Chartists community in determining the relative health of the markets.
Current ETF positions are:
In cash.
Daily Trading Action
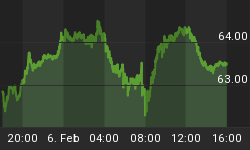
The major index ETFs opened lower and then began to move higher, a move that lasted until the final hour of trading. At that point, the move was mostly sideways to slightly weaker. The Russell-2000 (IWM 79.34 +0.92) gain about 1.2% erasing much of Tuesday's 1.6% loss. The Semiconductor Index (SOX 417.09 +1.51) gained about one third of one percent adding to gains it made on Tuesday. The Bank Index (KBE 26.82 +0.39) gained most of two percent and the Regional Bank Index (KRE 26.91 +0.43) made similar gains. The 20+ Yr Bonds (TLT 91.46 -2.06) sold off hard losing -2.2% and closing back below 20-Day Moving Average (DMA) and bouncing off its lower Bollinger Band (BB) to finish at its lowest level since it bottomed on December 15th. The Longer-term bonds (TLT), the Rusell-2000, the Semiconductor Index, and the Regional Bank Index all remain in trading states while the other indexes we regularly monitor are in uptrend states. NYSE volume moved back to around average with 1.041B shares traded. NASDAQ volume was above average with 2.071B shares traded.
In addition to the weekly crude oil inventory report, there were four economic reports of interest released:
- MBA Mortgage Purchase Index for last week showed a gain of +2.3%
- Challenger Job Cuts (Dec) fell by -29%
- ADP Employment Change (Dec) came in at +297K versus an expected +100K
- ISM Services (Dec) rose to 57.1 versus an expected 55.7
The first three reports were released more than an hour before the open with futures getting more and more positive as the market readied to open. The ISM Services report was released a half hour into the session. All four reports were quite positive and all beat expectations.
If the ADP report was well correlated with the monthly non-farm payrolls number (due out on Friday), this would have turned futures markets to positive before the open. As it was, since it is often not well correlated to the U.S. government's non-farm payrolls report, it took market participants awhile to completely warm up to it. It was truly an outstanding beat and was the primary reason the markets finished higher. It should be noted that Asian markets finished mixed and European bourses finished significantly lower. This is what caused U.S. markets to open lower, but the bullish economic reports handcuffed the bears in their intent to take the markets lower.
The U.S. dollar opened about 1.1% higher and settled with a gain of just over one percent.
Financials (+1.2%) led the way higher joined by seven of the other ten economic sectors in the S&P-500. Materials were unchanged while Utilities (-0.6%) was the only sector to move lower.
Implied volatility for the S&P-500 (VIX 17.02 -0.36) fell two percent and the implied volatility for the NASDAQ-100 (VXN 18.35 -0.55) fell three percent.
The yield for the 10-year note rose fourteen basis points to close at 3.48. The price of the near term futures contract for a barrel of crude oil rose ninety-two cents to close at $90.30. The weekly U.S. government crude oil inventory report showed a draw down of -4.16M barrels.
Market internals were positive with advancers leading decliners 7:5 on the NYSE and by 12:5 on the NASDAQ. Up volume led down volume 11:4 on the NYSE and by more than 2:1 on the NASDAQ. The index put/call ratio rose 0.05 to close at 1.09. The equity put/call ratio rose 0.05 to close at 0.49.
Commentary:
Wednesday saw the opportunity for the bears to cause a correction slip away. This means that the overwhelming bullish consensus continues and the market continues to march higher. We were prepared to short the major indexes but we didn't get the conditions to allow us to enter the short positions. Instead, we will have to continue to wait patiently (or impatiently) for the set-up once again. Sometimes you will get a "perfect storm" and you can see the market predictably sell-off. We haven't had those sort of conditions for awhile now, but the bullish confidence is at extreme levels. It will eventually break, and the longer this uptrend is sustained without a correction, the more extreme the correction is likely to be.
With the major equities all finishing higher, our conditional orders couldn't be executed and we will move back to taking no action until we see the appropriate set-up. While I am sure many of you are frustrated, you can't force a trade, you have to let the market come to you.
We hope you have enjoyed this edition of the McMillan portfolio. You may send comments to mark@stockbarometer.com.


