


When it comes to investor enthusiasm for this market, there is only one thing I can say: even the extremes have become extreme. This is an high wire act - without a safety net - that I have chosen not to play. The rare exception to too many bulls is that "it takes bulls to make a bull market," and under such conditions, the markets just continue higher despite the wildly bullish sentiment readings. Think 1995, 1998/99, 2003 and 2009 when the extreme bullish sentiment readings didn't see the market correct but just continue higher. Even if this is the scenario that is developing, investor sentiment is at a level of bullishness -extremus maximus - where a pullback in price is usually seen.
The "Dumb Money" indicator (see figure 1) looks for extremes in the data from 4 different groups of investors who historically have been wrong on the market: 1) Investors Intelligence; 2) Market Vane; 3) American Association of Individual Investors; and 4) the put call ratio. The "Dumb Money" indicator is very bullish to an extreme degree, and as figure 1 shows, such "super extremes" in the indicator coincided with market corrections in this cyclical bull market.
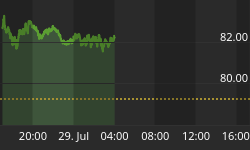
Figure 1. "Dumb Money"/ weekly
Figure 2 is a weekly chart of the SP500 with the InsiderScore "entire market" value in the lower panel. From the InsiderScore weekly report: "The year ended with a whimper as insider transaction volume slowed significantly due to the holidays and the closure of trading windows. Sellers, nonetheless, outnumbered buyers for the eighteenth straight week and 43rd week of the year's 52. Activity will remain light for the next few weeks as companies prepare to report Q4'10 results."
Figure 2. InsiderScore "Entire Market" Value/ weekly
Figure 3 is a weekly chart of the SP500. The indicator in the lower panel measures all the assets in the Rydex bullish oriented equity funds divided by the sum of assets in the bullish oriented equity funds plus the assets in the bearish oriented equity funds. When the indicator is green, the value is low and there is fear in the market; this is where market bottoms are forged. When the indicator is red, there is complacency in the market. There are too many bulls and this is when market advances stall.
Currently, the value of the indicator is 69.30%, and this is the highest value in 10 years of data. Values less than 50% are associated with market bottoms. Values greater than 58% are associated with market tops.
Figure 3. Rydex Total Bull v. Total Bear/ weekly
Improve your market timing with Premium Content from TheTechnicalTake.
The Premium Content service is the best $104 you will ever spend on market research. The daily report is meant to keep you on the right side of the market and improve your market timing. That's 40 cents a day!
Even in this confusing market environment, The Premium Content service has been useful in identifying trading opportunities. The indicators have functioned as expected!!!
To learn more about this service click here: Premium Content


