


Summary of Index Daily Closings for Week Ending September 10, 2004
| Date | DJIA | Transports | S&P | NASDAQ | Jun 30 Yr Treas Bonds |
| Sep 6 | M A R K E T S C L O S E D L A B O R D A Y | ||||
| Sep 7 | 10341.16 | 3180.24 | 1121.30 | 1858.56 | 110^09 |
| Sep 8 | 10313.36 | 3188.79 | 1116.27 | 1850.64 | 111^08 |
| Sep 9 | 10289.10 | 3193.90 | 1118.36 | 1869.65 | 110^26 |
| Sep 10 | 10313.07 | 3224.38 | 1123.92 | 1894.31 | 111^03 |
| SHORT TERM FORECAST (Next Two Weeks) | ||||
| TREND | PROBABILITY | Legend | ||
| Substantial Rise | Low | |||
| Market Rise | Medium | Very High | 80% | |
| Sideways | Medium | High | 60% | |
| Market Decline | High | Medium | 40% | |
| Substantial Decline | Medium | Low | 20% | |
| Very Low Under | 20% | |||
| INTERMEDIATE TERM FORECAST (Next 12 Weeks) | ||||
| TREND | PROBABILITY | Substantial | 800 points+ (DJIA) | |
| Substantial Rise | Low | Market Move | 200 to 800 points (DJIA) | |
| Market Rise | Medium | Sideways | Up or Down 200 (DJIA) | |
| Sideways | Medium | |||
| Market Decline | High | |||
| Substantial Decline | High | |||
This week the Dow Jones Industrial Average closed up 52.87 as it finishes its corrective rally from August 13th. The decline over the past three days was not impulsive, therefore was not the start of the next significant down-leg we are calling for. The decline was clearly corrective, meaning another thrust higher is needed before the key reversal. However the rally is getting long in the tooth, as the Industrials have been up five weeks in a row.
Volume has been higher since Labor Day, but remains below average for 2004 - not a lot of conviction for this up-leg.
Stocks are nearing overbought levels where declines are often seen. Complacency is showing up once again in the VIX, a contrary indicator - and is Bearish. September and October are historically the worst months of the year for stocks, which may be why the 10 Day Average Call/Put Ratio has not yet reached sell signal levels. Commodities are lower this week and there is a great deal of evidence that deflation is nearby.
| Equities Markets Technical Indicator Index (TII) ™ | ||||
| Week Ended | Short Term Index | Intermediate Term Index | ||
| May 14, 2004 | (25.75) | (66.45) | Scale | |
| May 21, 2004 | 22.00 | (67.23) | ||
| May 28, 2004 | ( 3.50) | (48.48) | (100) to +100 | |
| June 4, 2004 | (55.75) | (34.07) | ||
| June 11, 2004 | (77.75) | (25.92) | (Negative) Bearish | |
| June 18, 2004 | (40.25) | (31.17) | Positive Bullish | |
| June 25, 2004 | (34.00) | (26.10) | ||
| July 2, 2004 | (41.50) | (27.64) | ||
| July 9, 2004 | (32.50) | (30.21) | ||
| July 16, 2004 | (33.75) | (41.99) | ||
| July 23, 2004 | (59.00) | (49.98) | ||
| July 30, 2004 | 46.25 | (52.18) | ||
| Aug 6, 2004 | (38.00) | (50.40) | ||
| Aug 13, 2004 | (15.75) | (49.03) | ||
| Aug 20, 2004 | 9.25 | (43.82) | ||
| Aug 27, 2004 | 9.25 | (39.81) | ||
| Sep 3, 2004 | (39.25) | (40.06) | ||
| Sep 10, 2004 | (49.25) | (45.78) | ||
This week the Short-term Technical Indicator Index comes in at negative ( 49.25), indicating a market decline, possibly severe, is probable. This indicator is a useful predictor of equity market moves over the next two weeks, both as to direction and to a lesser extent strength of move. For example, readings near zero indicate narrow sideways moves are probable. Readings closer to +/-100 indicate with a higher degree of confidence that an impulsive move up or down is likely over the short run. Market conditions can change on a dime, or the Plunge Protection Team can come in and temporarily stop market slides, so it may be unwise to trade off this weekly measured indicator.
The Intermediate-term Technical Indicator Index is useful for monitoring what's over the horizon - over the next twelve weeks. It serves as an early warning system for unforeseen trend changes of considerable magnitude. This week the Intermediate-term TII comes in at negative (45.78).
Markets seek order, both in terms of price and time, which is why so often retracements or trend turns occur at Fibonacci percentages and numbers. Briefly, Fibonacci numbers are a sequence where the next number is the sum of the prior two, and the ratio of the two addends to the total are either .382 or .618. For example, Fibonacci numbers are 1, 1, 2, 3, 5, 8, 13, 21, 34, 55, 89, 144, etc... 13 plus 21 equals 34. 13 is .382 of 34 and 21 is .618 of 34. 34 plus 55 equals 89. 34 is .382 of 89 and 55 is .618 of 89. .786 is the square root of .618. .236 is the difference between .618 and .382.
The charts on the next page estimate the probable dates for the next significant leg down, using Fibonacci numbers of trading days from prior highs and lows. From the closing high on June 23rd 2004 to September 13th will be a Fibonacci 55 (+1) trading days. From that same beginning point - June 23rd - to the closing price low on August 12th were a Fibonacci 34 (+1) trading days. From that Aug 12th low to Sep 13th is a Fibonacci 21 trading days. Together these two trends - first down, then up - form the golden phi ratio .618 to .382, both combining together to equal 1.000.


Further, the prior closing top in the DJIA - April 6th's - was also a Fibonacci 55 (-2) trading days from June 23rd's top. We mentioned last week that there was a cluster of Fibonacci trading day periods converging the week of 9/8/04 to 9/13/04. Clusters like this often signal times for key trend reversals - in the current case down. Thus it is shaping up that an intermediate-term top may be arriving either Monday or Tuesday, September 13th or 14th (plus or minus a day or two).
The above chart of the Dow Industrials (courtesy of www.stockcharts.com) shows the Elliott Wave count we believe to be most accurate at this time. On June 23rd, the DJIA completed a truncated Minor degree wave 5 up of Intermediate degree wave C up of Primary degree wave (2) up. Then, over the next 55 (+ 1) trading days, a five wave (down-up-down-up-down) impulse move bottomed on 8/12/04 (using closing prices) - the completion of Minor degree 1 down of Intermediate degree 1 down of primary degree (3) down. Minor degree wave 2 up is nearing completion, the "a" and "b" and four of the Minute degree five waves of "c" in the books, and all we wait upon is the final Minute degree wave 5 up of "c" of Minor degree 2 up. Then on to wave 3 of 1 of (3) down.
A possible price target for this rally is 10,400, a .882 (Fibonacci .500 plus Fibonacci .382) retrace of the June to August move down. We've already hit the .786 retrace, 10,336, so with another thrust up needed, .882 is the next logical target. This retrace percentage is close to the retrace of the April 6th to May 17th decline with the May 17th to June 23rd rally. No guarantees. Terminal 5ths can truncate. The MACD's histograms' slope appears to be flattening, ready to roll over. The RSI has hit the same level that the three prior tops in 2004 hit. The next decline could surprise a lot of folks.

The Dow Industrials find themselves in a precarious position as of Friday September 10th's close. That is because of a second upside non-confirmation of a new higher high in the Transportation average. On Friday, the Transports hit a higher high for the move since October 2002 while the Industrials failed to come even close to confirming with a higher high of its own. Under Dow Theory, upside non-confirmations after Sell Signals are ominous warnings that something is seriously wrong with equities. On the next page is a chart showing that there were five divergences between the Transports and the Industrials since 1999, and every single time we had one, a stock market crash occurred shortly thereafter - within two to three months.
Dow Theory requires trends in the price action of one average - either the Dow Industrials or the Transports - to be confirmed by the other. Divergences are considered early warning signs of upcoming trend reversals. We currently operate under a Dow Theory Sell Signal as both the Dow Industrials and Transports reached new rally highs in late January 2004, then both hit lows on February 4th, followed by another new high in the Industrials that was not confirmed by the Trannies. Instead of reaching another new high, the Trannies began sinking lower, diverging with the Industrials. Before the Trannies could confirm the Industrials' new high, both averages declined to new closing lows the second week of March 2004, giving us a "Sell Signal" that has since not been reversed.
Then, on April 6th, 2004, the Dow Industrials hit a lower high, below their February 11th, 2004 peak of 10,737.70. The best the index could hit was 10,570.90. Meanwhile, the Transports hit their peak on January 22nd, at 3,080.32, then confirmed the DJIA's lower high with a top of 3,006.96 on April 22nd. So far so good as Dow Theory confirmed the downtrend. Trouble started when the Industrials hit a lower low of 9906.91 on May 17th, but the Transports failed to confirm, instead hitting a higher low of 2,810.01 on May 10th before turning up. This produced a Bullish non-confirmation, warning of the possibility of a new uptrend in both indexes. The Trannies then went on a tear, rising all the way to 3,204 on June 30th, hitting a new higher high, beating their previous high of 3,080 on January 22nd. The Industrials followed suit by rallying, but failed to rise above their previous February 11th high. Upside non-confirmation # 1. A downside non-confirmation occurred next when the Industrials hit a new lower low on August 12th while a new lower low was not reached by the Trannies. Instead the Trannies took off, hitting a new higher high since October 2002, on Friday September 10th, of 3,224. The Industrials followed the direction of the Trannies, but failed to rise above both their previous two lower highs of 10,479 June 23rd and 10,570 on April 6th, and their previous all time high since the October 2002 lows of 10,727 on February 11th. Upside non-confirmation # 2.
These are flagrant divergences. Unless the Industrials mark time and catapult above 10,737, then we can expect no less than a stock market crash. That's 424 tough points under overbought, low volume conditions. Not likely.
The following chart shows divergences over the past five years and subsequent crashes. There is no reason to believe the consequences of the latest divergence - which is one of the most significant - should be any different.


The QQQs, our proxy for the NASDAQ index, have completed a Bearish Head & Shoulders pattern that is confirmed by the decisive break below the neckline in early August. The current rally is clearly corrective, tracing out an a-b-c with a and b (triangle) complete, and c finishing up. The rally should end some time over the next week or so and could hit the 61.8 percent retrace of Minor degree wave 1 down of Intermediate degree wave 3 down, taking prices to perhaps as high as 35.80.
The Head & Shoulders pattern has a minimum downside target of 29, the distance from the neckline to the head subtracted from the neckline. Since we last presented the QQQs, the rally has matured to the point where the RSI is approaching levels seen at several prior tops and the MACD is looking tired and ready to rollover.
The other pattern in play here - not shown - is a Rounded Bearish Top that is over a year in formation. It is textbook perfect, a no-doubt-about-it pattern of distribution from smart money to notso- smart. The next decline according to the Elliott Wave count is a Minor degree 3 down of Intermediate degree 3 down of Primary degree (3) down. That should be fast and furious. Should be.

The SPX to VIX Ratio has risen to 81.74, one of the highest readings over the past six years. Only once - in 2000 - has it been higher. In 2004, each time it exceeded 80.00, the market topped and a short-term decline immediately ensued. This fits our Fibonacci turn date analysis and supports our Elliott Wave counts. Any more rally over the next two days could push this indicator to heights that demand caution.
The other boutique indicator we follow is the 10 day Average Call/Put Ratio. As of September 9th, this sat at 1.11. Generally we've found that when this ratio falls below 1.00, a rally is imminent, and whenever it reaches 1.40, a top is at hand.
This ratio peculiarly sits in the neutral range when you would think it would be pushing up toward 1.40 where optimism reigns. One explanation for this rally not creating more bullishness in this indicator might be the reputation of the season we find ourselves in. September and October are known for sharp declines and investors may be practicing an abundance of caution by keeping their ratio of puts high compared to calls. If that is the case, then a level of 1.11 may be acceptable to support a decline.
The Economy:
Let the "election homestretch" parade of improving economic numbers begin.
The Labor Department reported that the PPI (Producer Price Index) "unexpectedly" fell in August by 0.1 percent. Excluding food and energy it also fell 0.1 percent. Deflation. So no need for the Fed to bump rates this month. But if the stock market is stable, they will.
The Commerce Department reported the Trade Deficit fell to $50.1 billion in July from $55.0 billion in June. Still, it was the second worst monthly reading - ever. The deficit with China set a new record high at $14.9 billion.
Delta Airlines announced it was cutting 7000 jobs to avert bankruptcy, according to www.cnnmoney.com on Friday. U.S. Air could file for bankruptcy over the weekend, according to the New York Times. This one could be liquidation, not reorganization. And according to CNN/Money, Disney's Michael Eisner will call it quits in two years. Stocks reaction - "who cares."
The Labor Department's new overtime regulations were blocked by the Republican-controlled House of Representatives, denying the funds to enforce them. The regulations have hit an estimated 6.0 million workers.
And the Labor Department announced Jobless Claims fell to 319,000 for the week ended September 4th from 363,000 the prior week. The total number of folks collecting unemployment checks came in at $2.898 million - up 20,000 for the week ended August 28th. This number excludes people who remain unemployed or underemployed whose benefits have run out.
Money Supply, the Dollar, & Gold:
M-3 fell $11.3 billion the last week reported and is down $4.7 billion over the past 11 weeks. Our research has found that periods of time where M-3 plateaus or declines for more than two months precede equity market declines.
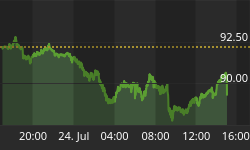
The trade-weighted U.S. Dollar has stalled at the upper boundary line of its long-term declining trend-channel. It is also finding fierce resistance at its declining 50 Day moving average. Its 50 Day MA remains substantially below its 200 Day MA and the 200 Day MA is pointed down. The recent rally has lost its momentum as the MACD is flat-lined. The recent rally is clearly corrective. The RSI may provide the best clue as to what lies immediately ahead. It sits where prior declines have started. A decline below 87 will confirm a Head & Shoulders Top pattern shown in prior week's issues. Should that occur, we see a minimum downside target of 82 according to the pattern. A decisive breakout above the downward sloping trend-channel's upper boundary line would be Bullish. We don't expect that to happen. The forces of resistance appear too strong and are based upon a powerful long-term trend.
Like the Dollar, Gold is crawling along its 50 Day moving average, but along its lower boundary line of its long-term trend-channel rather than its top. Since July 2003, about half the time, Gold moved in the same direction as the Dollar. One reason for this may be the influence of foreign investors using non-dollar currencies. If enough demand or selling occurs for Gold in non-dollar currencies, Gold can occasionally move in sync with the dollar. This has occurred fifty percent of the time since 2003. Gold remains inside its long-term rising trend-channel but is flirting with disaster. The MACD looks tired and toppy. The threat of deflation may be the cause. The PPI deflated and so has M-3. Unless the Fed pumps - and it would should equities collapse - Gold may feel pressed.


Below, the Morgan Stanley REIT Index ($RMS) has had a nice run which looks to be coming to an end. The RSI is overbought and turning down. The MACD is rolling over. And the Elliott Wave count - five waves up - looks complete.


Bonds and Interest Rates:
The Fed meets later this month and if they can get away with it, will likely raise short-term interest rates another quarter. With deflation around the horizon, the Fed needs to build up its ammo, but in the process may bring deflation sooner than it wants. The economy looks to be stalling regardless, so a massive liquidity pump will eventually be needed. The Fed would love to have short-term rates above 3 percent when that happens. That may not be possible.
The above chart (courtesy of www.stockcharts.com) is pretty much the same as we've been showing for the past several weeks. There is a massive Bearish Head & Shoulders top that looks to be forming. Confirmation would come with a price decline below 100. The MACD looks tired, ready to rollover and corrective wave 2 has now completed a .786 retrace of wave 1 down - a common retrace percent for wave 2's over the past several years in many different markets.
An equity market sell-off would likely initially boost Bond prices, however the Fed's probable quick monetary-infusion response would soon send both the Dollar and Bonds lower, fulfilling the expectations we see per the technical chart patterns.
Bottom Line: The rally since mid-August is coming to conclusion, likely over the next few days. Sentiment will be high when this market turns down, and many will be surprised. Caution is warranted.
"So shall My word be which goes forth from My mouth;
It shall not return to Me empty,
Without accomplishing what I desire,
And without succeeding in the matter for which I sent it."
Isaiah 55:11
Special Note: Be sure to register under the subscribers' section at www.technicalindicatorindex.com for e-mail notifications and password access of our new mid-week market analysis, usually available on either Tuesdays or Wednesdays. These midweek updates are only available via password access when posted on the web.
| Key Economic Statistics | ||||||||
| Date | VIX | Mar. U.S. $ | Euro | CRB | Gold | Silver | Crude Oil | 1 Week Avg. M-3 |
| 4/08/04 | 16.38 | 89.82 | 120.56 | 284.00 | 419.9 | 8.09 | 37.14 | 9060.6 b |
| 4/16/04 | 15.00 | 90.18 | 119.50 | 276.75 | 401.6 | 7.14 | 37.74 | 9115.2 b |
| 4/23/04 | 14.01 | 91.34 | 118.18 | 267.50 | 395.7 | 6.16 | 36.46 | 9122.6 b |
| 4/30/04 | 16.69 | 90.76 | 119.70 | 270.75 | 387.5 | 6.07 | 37.38 | 9171.5 b |
| 5/07/04 | 18.13 | 91.30 | 118.83 | 270.40 | 379.1 | 5.58 | 39.93 | 9230.2 b |
| 5/14/04 | 18.47 | 91.81 | 118.69 | 267.00 | 377.1 | 5.72 | 41.38 | 9232.3 b |
| 5/21/04 | 18.44 | 90.53 | 120.05 | 268.75 | 384.9 | 5.87 | 39.93 | 9278.0 b |
| 5/28/04 | 15.52 | 88.98 | 122.10 | 276.25 | 394.0 | 6.11 | 39.88 | 9251.6 b |
| 6/04/04 | 16.57 | 88.50 | 122.93 | 274.75 | 391.7 | 5.81 | 38.49 | 9263.5 b |
| 6/11/04 | 15.10 | 89.23 | 121.01 | 269.25 | 386.6 | 5.78 | 38.45 | 9272.5 b |
| 6/18/04 | 14.95 | 89.41 | 121.17 | 267.75 | 395.7 | 5.98 | 39.00 | 9309.9 b |
| 6/25/04 | 15.19 | 89.22 | 121.41 | 270.75 | 403.2 | 6.12 | 37.55 | 9297.7 b |
| 7/02/04 | 15.15 | 88.18 | 123.09 | 265.50 | 398.7 | 6.01 | 38.39 | 9326.4 b |
| 7/09/04 | 15.78 | 87.41 | 124.10 | 269.00 | 407.0 | 6.46 | 39.96 | 9263.5 b |
| 7/16/04 | 14.43 | 87.12 | 124.36 | 271.50 | 406.8 | 6.72 | 41.25 | 9258.9 b |
| 7/23/04 | 16.50 | 89.23 | 120.88 | 269.50 | 390.5 | 6.33 | 41.71 | 9280.1 b |
| 7/30/04 | 15.27 | 90.12 | 120.10 | 267.00 | 391.7 | 6.56 | 43.80 | 9292.6 b |
| 8/04/04 | 19.34 | 88.45 | 122.69 | 268.25 | 399.8 | 6.77 | 43.95 | 9286.5 b |
| 8/13/04 | 17.98 | 87.97 | 123.68 | 269.19 | 401.2 | 6.62 | 46.58 | 9268.6b |
| 8/20/04 | 16.00 | 88.22 | 123.03 | 279.50 | 415.5 | 6.87 | 46.72 | 9280.0b |
| 8/27/04 | 14.74 | 89.80 | 120.20 | 275.00 | 405.4 | 6.58 | 43.18 | 9316.5b |
| 9/03/04 | 14.28 | 89.56 | 120.66 | 275.25 | 402.5 | 6.59 | 43.99 | 9305.2 b |
| 9/10/04 | 13.75 | 88.60 | 122.61 | 272.50 | 403.8 | 6.16 | 42.81 | - |
Note: VIX Complacent, Dollar, CRB, Silver, and Oil are down.


