


A 3-dimensional approach to technical analysis
Cycles - Structure - Price projections
"By the Law of Periodical Repetition, everything which has happened once must happen again, and again, and again -- and not capriciously, but at regular periods, and each thing in its own period, not another's, and each obeying its own law ... The same Nature which delights in periodical repetition in the sky is the Nature which orders the affairs of the earth. Let us not underrate the value of that hint." -- Mark Twain
A Review of the Past Week
The short term up trend continued to make upward progress this week. The SPX initial projections of 1118 to 1122 contained prices for several days, but by the end of the week there was an attempt to break through to the upside with a close at 123.92.
When projection levels in an up trend are reached, one of two things happen: there is a distribution phase from which prices eventually break down, or there is a re-accumulation phase followed by a continuation of the up trend. Prices will eventually confirm which of the two is taking place, depending on the existing cyclic configuration.
I believe that we are in a short term distribution phase and as a result, on Friday morning I issued a pre-opening SELL ALERT, and stated that a SELL SIGNAL would be generated if prices fell below 1114 on negative hourly A/D of 1000 or more. This did not happen Friday, but the SELL ALERT remains in effect. Although we surpassed Tuesday's high of 1124.08 by a small margin, the A/D on Tuesday was a positive 1521, while Friday it never went beyond a positive 650.
The loss of momentum in the A/D is confirmed by a diminishing NH/NL ratio which dropped from net positive 205 on Tuesday to a net positive 129 yesterday, and by the hourly momentum indicators which show negative divergence as well as an overbought condition.
The Daily indicators are in the same fix, with the McClellan oscillator beginning to show negative divergence and the momentum indicators being overbought. These conditions may not lead to an immediate reversal and it could take a few more days for the top formation to be complete, but they clearly indicate that caution is warranted. Ergo: SELL ALERT! Trend lines will have to be broken and levels penetrated for a confirmed sell. At this time, the critical level remains SPX 1114.
Current Position of the Market.
Long Term Trend: The long term trend turned up in October 2002 in conjunction with the 12-year cycle. It is still in a BUY/HOLD mode, and is likely to top out at some point in 2005. No change this week.
Intermediate trend: A BUY ALERT remains in place for the SPX. Prices have not yet moved out of their intermediate downtrend channel, and more basing action will probably take place as a result of the intermediate cycles making their lows in early October. No change this week.
The Short Term Trend is up and topping. Because of market volatility, the short term trend is better analyzed on a daily basis. This is done in our daily market updates and closing comments.
Note: If you would like to receive an explanation of how I arrive at these signals, how to use them in a trading strategy and be notified on the day that they occur, please let me know at ajg@cybertrails.com
The Short Term Trend is being monitored continually through daily Closing Comments.
IMPORTANT NOTE: If you have requested to be placed on our email alert list and have not been receiving emails on a daily basis, please notify me so that I can identify the source of the problem.
What's next?
Unless we immediately develop some upside momentum from here with much improved prices and strong A/D readings, this has to be considered a distribution pattern. As pointed out by one of our readers, the SPX is near its 233rd week from the 2000 market high -- an important Fibonacci number in the sequence. Since, based on cycle analysis, we have been looking for just such a top for the final retracement into October before an intermediate term trend can really take hold, this time frame makes perfect sense, just as the 89th week from the October 2002 low marked an important short term top. The hourly and daily charts of the SPX which appear below will illustrate the current technical position very clearly.


Another interesting chart -- recently brought to my attention by another one of our readers -- is that of the SPX/VIX ratio which appears to be an excellent short term indicator of overbought and oversold conditions. It certainly seems to confirm that we are at or very near a top.

SUMMARY: The intermediate term trend continues to improve and prices are beginning to challenge the upper reaches of the channel which marks the correction from the March 2004 highs, but we don't appear to be in a position to break out decisively to new highs before one more pull-back.
The short term trend has become extended, is showing signs of deceleration, and is meeting with increasing overhead resistance. A few more days of top building seems likely.
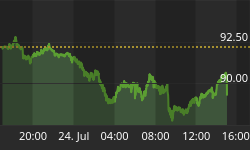
Gold
While this is not my primary focus, I take an occasional glance at it and noticed that the commercial traders had begun to increase their short position once again. The following charts of bullion and the XAU should make it plain why they are doing so. Another decline appears to be just around the corner.


