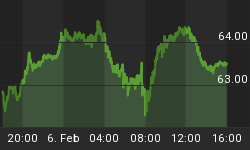
If you have ever looked at the 1 minute TICK, it looks like a picture of chaos as seen below.
But it can be used by investors looking for an entry point, or by Day Traders by using a simple trick as seen on today's second chart ...

The chart below is the same Tick chart as above, but with a Smoothed Moving Average of 80.
Notice what happens if you draw a horizontal line at zero and watch the green Smoothed Moving Average as it rises above or below the line.
When it is above zero and trending higher, the SPY (seen on the bottom of the chart) has a nice intra-day up rally ... see the white circles.
Now, look at what happens when the green Smoothed Moving Average falls below the zero line where the orange circles are. The SPY had an intra-day drop worth paying attention to.
That is our Tip for today, have a great weekend ... If you are not already one of our paid subscribers, why not given it some consideration?


