


If you look at the weekly charts of the Dollar, Gold and CRB Index price has virtually ground to a halt. The stock market, as in the S&P500, is sitting on the fence contemplating a jump (i.e., breakout to the upside), and interest rates are sitting on the edge peering into a deep crevasse.
Something is going to happen and that something is going to happen soon.
A breakout from this consolidation has to be imminent. That should be apparent but what is the message or scenario most likely to play out?
INTEREST RATES
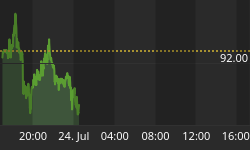
Let's look at the yield on the Ten Year Treasury Bond. Refer to the weekly chart in Figure #1. The yield is below its 200 day moving average (red line) and it is also probing
Figure#1/ Ten Year Treasury Yield
the up trend line EF. A weekly close below this line would suggest lower yields possibly below 4%. Support on the chart can be found at 37.74.
Clearly what has been driving the stock market the past couple weeks has been lower interest rates. This is not only reflected in the NYSE advance decline line, which is making new multi year highs from all those interest rate sensitive issues, but it can also be seen in the recent best performers like housing and the financials.
Why are rates going lower? Rates are lower because there is no heat in the economy. Look at inflation- not there. Look at the CRB Index, which is a good measure of a buzzing economy, and there is nothing there as well.
Lower yields and thus higher bonds should lead to higher stock prices. But don't bet the farm yet.
First, after a 5 month run bonds are near their 2004 highs. Second, the Rydex Bond bull bear ratio is showing that there are too many bond bulls. See figure #2.
Figure #2/ Rydex Bond Bear Bull Ratio
This ratio measures the assets in the Rydex Bond fund as a percentage of total assets in the bullish and bearish bond funds. Currently, the bullish assets are at an extreme level relative to total assets.
How have bonds performed over the past 5 years when there is this much enthusiasm for higher bond prices? Designing a trading system to go long bonds when the indicator crosses above the upper band; the position is held for 21 days. On the short side, a position is taken when the indicator crosses below the upper extreme, and the position is held for 21 days as well. The results are shown in the table below.
| Bull-Bear Bonds | ||
| Indicator Mode | Long Mode | Short Mode |
| Index | DJ Composite Bond | DJ Composite Bond |
| Time Period Studied | 7.5 years | 7.5 years |
| # of Trades | 8 | 8 |
| % Profitable | 50% | 62.5% |
| Annual Rate of Return | 0% | 559% |
| Average Run Up | .70% | 1.33 |
| Average Draw Down | 1.2% | .56% |
| Rina Index | (37) | 122 |
Going short bonds when the indicator was in this position was a much better trade from all measures. Particularly, I want to focus in on the "Average Run Up" and "Average Draw Down". "Average Run Up" refers to how much the position goes in your favor. As expected, the average run up is better when a position is taken opposite those traders most likely to be wrong. The "Average Draw Down" refers to how much your position went against you before you made a profit, and once again, our short position had less of a draw down.
Ok how does all this relate to the stock market? In the short term, I would expect bonds to pull back (i.e., rates to go higher), and since this rally has been interest rate driven, I would expect a pullback in here. This seems to coincide with the intermediate term breadth indicators which suggest that the stock market is a bit overextended.
With regards to bonds themselves, yields appear to be eventually going lower, but as I have argued just not yet. All this bodes well for stocks.
From a longer term perspective, it appears that the S&P500 is setting up for a breakout of this multi - week congestion. See Figure #3. The Price Structure Analysis Trendline
Figure#3/ S&P500/ weekly
Break Trading System (which you can get by visiting thetechnicaltake.com) has almost triggered a signal, and some of the longer term breadth data suggests that August was a good intermediate term bottom. I will go over these ideas in greater detail in short order.
But in keeping with my previous comments regarding speculative issues, I think that these will continue to under perform as the yield curve is not favorable, and sentiment has gotten a bit too bullish especially in everybody's favorite, the Semiconductors. But in the longer term, investors are still not buying in.
So wait for the pullback or let prices consolidate and continue to monitor.
DOLLAR, GOLD, COMMODITIES
Briefly how will lower rates relate to these markets? In general, I believe (and this is a belief from historical back testing) that gold does better when rates are contracting. Certainly, over the last four years this has been the case. It is an anticipatory "thing". Rates fall and inflation will follow, so buy gold before everybody knows that inflation is here. But I don't know if that is going to be the scenario this time. If gold rises we would expect the dollar to fall and commodities to follow suit. This would anticipate inflation. These markets are so congested that I think it is best to wait for some clarity (ie., the breakout). Although gold has risen over the last 5 months while interest rates have fallen, its ascent has been agonizing. It just seems that this time might be different.
That's TheTechnicalTake!
I hope you have found my analysis profitable.


