


Elliott Wave on the DOW
DOW Short Term Forecast Update
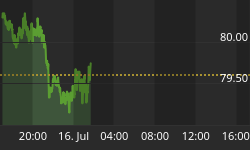
Many investors are confused with the choppy action on the DOW, so we have provided a chart to illustrate our forecast on the expected price action.
This corrective action is an ending diagonal pattern which is a terminal pattern. We should see further upside towards the recent highs with a a sharp decline to at least the starting point of the ED pattern. We will likely see a brief rally at this level before further downside.
DOW
Once this pattern completes we are expecting a major reversal with significant downside to follow. This will be end of the current wave up with two possibilities on the downside targets. Once the reversal begins we should have more insight on which target area will play out.
We also have been following longer term Ending Diagonal patterns for the CAD and and Crude which are also close to completion.
These charts are only a guide so that you can follow the action and watch for the expected outcome. The action could play out exactly as illustrated or it may need minor adjustments as we follow it through.
Happy Trading!!!
If you are interested in viewing these updated charts and other detailed charts with targets on a daily basis, please see the registration details below.
To learn more on the status of Gold, Silver, HUI and the USD, please visit the link below for registration details. The commentary and forecasts are updated daily, including intraday commentary and chart updates. Fibonacci pivot dates and cycle analysis are also utilized to forecast reversal dates. The indices covered include the NASDAQ, DOW, S&P 500, SOX, Nikkei, DOW Transports, TSX, BSE, SSEC, AORD, HSI, DAX and FTSE. Commodity charts include Copper, XOI, Crude Oil, Gold, GLD ETF, Silver, SLV ETF, HUI and/or the XAU (Gold and Silver index). Additional Elliott Wave charts cover the US Dollar (USD), EURO FXE ETF, Canadian Dollar (CAD) FXC ETF, 10 Year Treasury Note Yield (TNX), Bank Index (BKX), Central Fund (CEF), CAD Gold units (XGD.TO), Gold Corp, Pan American Silver, Newmont Mining (NEM), and Agnico Eagle Mines (AEM)
With market timing and Elliott Wave Forecasts, we can be on the right side of the market.


