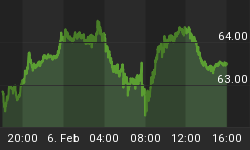
We thought we'd share with you the nuts and bolts of a day trade we conducted for our Platinum Subscribers Thursday, March 3rd, and Friday March 4th. First of all, not all trades are alike, and past performance is no guarantee of future performance. But this trade, which we show progressions for in this article, was a classic. On March 3rd, we noticed that the huge upside rally (200 points in the Industrials) had been largely on the rumor that a positive jobs report was likely to come out the next day, Friday March 4th. The rise took prices to a very short-term overbought condition. Further, it was possible to count the rise as a completed wave {c} rally wave of an {a} up, {b} down, {c} up move. So, we felt the odds were decent that a decline would be coming Friday near the open. Thus we wanted a short position in place before Friday's open, but needed to take that short position right before the close Thursday, so that we would catch the rally near its peak.
We entered an open put options position in the QQQQ's, which follow the NDX, at 3:55 PM EST Thursday, just before the close. We grabbed a March 31st expiration, strike price 58, the level just a hair out of the money, but close enough to being at the market so that any decline Friday would give us maximum price gains, and keep us near the money since we were using a high risk March 31st expiration. Our purchase price was 1.04 per options share, or $104 per contract. We bought 15 contracts for $1,560. We placed a tight stop loss at 0.90 immediately after opening the position late Thursday, limiting risk to $200.
In fact we were right, the market opened down Friday. Thinking this decline was going to track at least an a-down, b-up, c-down path, we planned to raise our stop after wave a-down had seen a decent move, from 0.90 to breakeven, at 1.04. We then watched a corrective wave b-up unfold, and measured time and price movement off of the a-wave decline to estimate when b-up would finish. Then we used the same time/price speed box to estimate wave c-down's downside target and time of reaching that bottom. In fact c-down started as projected and fell as projected. We closed out the position at a price of 1.36, for a 30.7 percent profit in one day, near the bottom of wave c.

Prices fell to our projected downside target around 12:20 pm EST Friday, so we happily took our profit, a 30.7 percent return in one trading day. The drop was fast, and came earlier than the time projection allowed, but within the time window the box suggested for c-down. We chose not to be pigs by hoping for more downside since the Full Stochastics had already reached oversold levels and our minimum target was hit.
Prices then remained around those downside levels throughout the time period the box projected for wave c-down, allowing subscribers plenty of time to react to our notice that we sold. Interestingly, once wave c's time/price projection was exhausted, around 2:45 pm EST, prices then began a late day rally. The projection boxes worked perfectly.
Not all day trades are this clean, but this was one for the textbook.
We were being conservative by assuming the decline was an a-down, b-up, c-down move, as it is possible that the decline was impulsive and part of a larger five wave decline. But for day trading purposes, we wanted to plan for a smaller decline than what in fact may have been transpiring, and not chance that we misplay the trade.

Available now, McHugh's exclusive Platinum Trading Service.
Check out our Standard Subscription Specials at the Subscribe Today button at www.technicalindicatorindex.com
We cover a host of indicators and patterns, and present charts for most major markets in our International and U.S. Market reports, available to subscribers at www.technicalindicatorindex.com
If you would like to follow us as we analyze precious metals, mining stocks, and major stock market indices around the globe, you can get a Free 30 day trial subscription by going to www.technicalindicatorindex.com and clicking on the Free Trial button at the upper right of the home page. We prepare daily and expanded weekend reports, and also offer mid-day market updates 3 to 4 times a week for our subscribers.
"Jesus said to them, "I am the bread of life; he who comes to Me
shall not hunger, and he who believes in Me shall never thirst.
For I have come down from heaven,
For this is the will of My Father, that everyone who beholds
the Son and believes in Him, may have eternal life;
and I Myself will raise him up on the last day."
John 6: 35, 38, 40


