


SPX analysis
Weekly chart
In order to get a complete perspective on the market, it is best to start by analyzing the longer term trend. The weekly chart of the SPX which appears below should leave little to the imagination about the past present and future market positions. The combined labeling of major cycles, drawing of trend and channel lines, and studying of indicator configurations give us a very clear picture of what has taken place and why, and of what to expect in the future.
The long-term 6-yr and 7-yr cycles (in conjunction with other factors normally associated with important cycle lows) were responsible for the short, but devastating bear market which occurred from October 2007 to March 2009. Since then, we have been in a bull market with only one serious interruption caused by the bottoming of the 2-yr and 4-yr cycles, and we should probably expect another one going into July through October, as the 1-yr, 9-mo, and 3-yr cycles make their lows.
By drawing a few judicious trend lines, we can see that the index has been rising in a long-term (green) channel. It dipped below the median when the 2-yr and 4-yr cycles bottomed, and has just risen above it again, showing that it still has plenty of upside momentum. Yes, but for how much longer?

The blue channels delineate the intermediate trends of the bull market. The second one is narrower, but just as steep as the first; a sign of strength! Normally, the trend will start to decelerate before a reversal takes place and this shows up on the chart as the inability of prices to reach the top trend line, followed by a move down into the lower half of the channel, and finally a move out of the channel. Since SPX has recently touched the top channel line, we can conclude that there is still no intermediate deceleration. If we show some on the next high, we can start thinking about a more significant reversal and, of course, the approaching cycle lows are warning us that this may not be too far away.
Another early warning comes from the lower indicator. If history repeats itself, it will start rising again but, as the index makes a new high, the indicator will not, thereby creating some negative divergence.
Within this longer-term context, let's now analyze the daily chart to see what it has to say about the nearer term.
Daily chart
On this chart, the same two channels are blown up, and shorter cycles have been added. The 17-wk cycle low, closely followed by the 90/180-day time frames from respective lows were most likely responsible for the recent correction. The indicators, which showed negative divergences, warned of an approaching reversal, and the breaking of important trend lines confirmed that a correction was taking place.
From the current position of the indicators, we can deduce that this correction is still in effect, but that it may not last too much longer because the breadth indicator is already trying to get back into an uptrend. However, until all have given a clear buy signal, we are still in a consolidation phase.

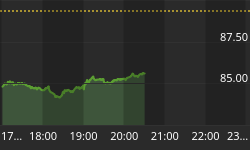
Hourly chart
We can get a better idea of how that consolidation is going by moving down another notch in time to the hourly chart.
On this chart, we add another very important dimension to our analysis: projections which are derived from Point & Figure studies. As a base or re-accumulation phase forms, the P&F chart can be used to suggest how far the next move will carry. At present, there is a strong suggestion that 1365 can be reached before coming to the end of the trend which started at 1041. Since this projection has been re-affirmed a few times, it would behoove us not to get too bearish before we get there -- unless there are serious technical negatives cropping up before that level is reached.
On the hourly chart, we also notice the warning that was given by the indicators as we met the 1343 projection (given earlier), and we had discussed the negative wedge formation in the price structure. The break came when the trend line from 1275 was penetrated. In the process, the SPX also broke the (light green) trend line from 1041. That was a clue that this correction would take longer to resolve than others that had taken place since the intermediate low.
The consolidation is already nine trading days-long and may be taking the form of an ascending triangle which either completed on Friday, or could end with the minor cycle low due in a couple of days. At the close of trading on Friday, the SPX broke out of a small down-channel which could have marked the final wave of the triangle. However, since none of the indicators gave a coincident buy signal, a reversal remains unconfirmed.
The chart shows P&F phase projections up to 1365 which were taken across the 1304 base. If Friday's closing move turns out to be the resumption of the uptrend, there is already a confirming count to that level.
It the index is to reach that projection, it will probably have to get back above the broken green trend line. Note how its extension has already stopped the move twice. The QQQQ, although a little stronger than the SPX (a positive), was also stopped by a back-test of the same trend line on the hourly chart. Incidentally, if it makes a new high, the QQQQ has a P&F projection to 60.50-61.00 which corresponds to 1365 on the SPX.

Conclusion:
The SPX appears to be undergoing a short-term consolidation which may be nearly complete. If the uptrend resumes and makes a new high, it stands a good chance of reaching 1365, which may turn out to be an intermediate top.
Sentiment
Besides the obvious market strength, the long-term reading of the SentimenTrader (courtesy of same) is a powerful argument for higher prices in the equity indices.

The Dollar
Following are charts of UUP, the dollar ETF. The index has been in a steady downtrend since late November, but there are some signs that if may soon reverse. The daily MACD (on the right) is showing some divergence, and if price finds support before that evaporates, we can start making a case for a reversal.
The divergence is even more pronounced on the weekly chart. UUP has arrived in the vicinity of a level which has provided support for several lows since March 2009, and the P&F chart of the dollar has a reliable count down to 76.00. It closed Friday at 76.38.

Gold
Last week, I commented that GLD might be starting a new uptrend, or simply extending its top. We still can't tell which it is. GLD reached the near-term target which shows on the chart and has backed off a bit. If the former corrective pattern turns out to be a re-accumulation area, it is substantial enough to send the index to 1350 on the next move.

Oil
As a result of the turmoil in the Middle-East, as it begins to come of age, and the situation in Lybia in particular, oil has shot up and is in the headlines every day accompanied by the usual outlandish predictions that abound in this type of emotional environment. Let's take a look and see what it really seems capable of doing.
This is a daily chart of the United States Oil Fund (USO). When you apply a few trend and channel lines, it starts to make some sense. After a moderate rise to about 39, USO started to correct; but it began to accelerate upward when the situation in Lybia deteriorated. The surge has now reached a level where it should encounter the resistance created by the intersection of several trend and channel lines. It is also nearing a phase projection of 43, which can be derived from the 2009 base pattern, as well.
There are higher counts, but it would be logical for oil prices to pause at current levels, and this would give the equity markets an opportunity to advance to their next projected targets.

The WTIC chart (light crude continuous contract - EOD) attained an initial target price of 104 on Friday. This corresponds to 43 on USO, but it has a higher count to 106-107 which equals USO's 46.
The indicators at the bottom of the USO chart have reached overbought, but would need to show deceleration and divergence to suggest an immediate top.
FREE TRIAL SUBSCRIPTON
If precision in market timing for all time frames is something which is important to you, you should consider a trial subscription to my service. It is free, and you will have four weeks to evaluate its worth.
For a FREE 4-week trial. Send an email to: ajg@cybertrails.com
For further subscription options, payment plans, and for important general information, I encourage you to visit my website at www.marketurningpoints.com. It contains summaries of my background, my investment and trading strategies and my unique method of intra-day communication with subscribers. I have also started an archive of former newsletters.


