


Despite recent calls for a new bear market, the bulls still have a few things going for them as we kick off the week of trading:
- Friday's labor report came in above expectations.
- Defensive assets are lagging again.
- Energy investments continue to perform well.
- The Fed is still on track to complete QE2 as originally planned.
On March 10 with the S&P 500 trading at 1,320, we outlined some concerns relative to a possible market correction in VIX and 'Flash Crash' Assets Tell Us Bears Are Gaining Traction. The March 10 analysis was based primarily on the relative strength of defensive assets, such as the VIX and bonds. Today, we provide updated versions of the charts originally shown on March 10. Our concerns in early March relative to a correction were warranted as the S&P 500 subsequently dropped from 1,320 to an intraday low of 1,249 on March 16, representing a decline of 5.38%.
To set the stage for the more bullish readings we are looking at as of April 3, 2011, we will revisit the bearish commentary and charts of the VIX (VXX) and Utilities Index (XLU) as of March 9, 2010:
On Valentine's Day 2011, defensive assets began to show improving relative strength vs. the S&P 500. The flash crash winners highlighted in blue above have continued to draw increasing interest from buyers over the past four weeks (see relative strength charts below)...The relative strength lines of the VIX, or the "fear index," and utilities have moved higher in recent weeks, indicating increasing concerns about further downside in risk assets... While relative strength is a term from technical analysis, the concept of buyers becoming more interested in defensive assets falls under the common sense category when it comes to risk management.
Charts as of March 9, 2011

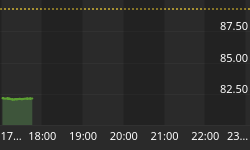
As shown in the same charts as of the close on April 1, the level of interest in defensive assets, such as the VIX and Utilities, is waning. The short-term bullish trends in defensive assets that were present in early March are no longer present (see break of green lines).

Interest in inflation-friendly and cyclical assets, such as energy, continues to increase which also favors bullish outcomes in the coming weeks. Unlike the VIX and Utilities (see above), the relative strength lines of the Energy Index (XLE) and Oil & Equipment Services Index (IEZ) have (a) maintained a bullish trend above the green lines, and (b) recently made higher highs (see green arrows).

On March 10, from an investment strategy perspective, we stated:
It is not time to panic relative to the possible continuation of the current correction, but we are happy we have taken some profits off the table in recent weeks. The defensive assets shown above will continue to help us monitor the risk tolerance of market participants, who ultimately determine the value of our portfolios.
Based on the decreasing interest in defensive assets and increasing interest in cyclical assets, along with positive earnings prospects, we began redeploying cash into energy (XLE) and energy-related positions (IEZ) on March 17. As long as the technicals and fundamentals continue to support bullish outcomes, we are happy to hold our positions in energy and other economic-expansion assets, such as industrials (VTI), mid-caps (IWP), materials (XLB), and commodities (DBC).
Friday's labor report, while far from wildly bullish, does indicate some steps in the right direction in terms of employment gains. Bloomberg summed up the report as follows:
Payrolls advanced by 216,000 workers in March compared with a 190,000 gain projected by economists in a Bloomberg News survey. The jobless rate dropped to 8.8 percent from 8.9 percent, the fourth straight decrease, the Labor Department said. The unemployment rate was projected to hold at 8.9 percent, according to the median forecast in the survey.
Just as we saw with the VIX and utilities, buyers are becoming disinterested in bonds (TLT) again relative to stocks. Recent inflation data and longer-term posturing from the Fed also paints a picture of an escalation in interest rates, which is negative for bonds (AGG).

Despite some recent chatter from some voting members of the Fed related to ending QE2 early, we have little indication from Ben Bernanke supporting that stance. Even if the Fed decides to curtail its planned bond purchases, their next formal statement is not due until April 27, which is more than three weeks away.
Gold (GLD) and gold stocks (GDX) are hybrids in that they can perform well in both inflationary and deflationary settings, at least for a time. Gold may make money when cyclical assets are in favor, but it may not be the best option for your opportunity-cost dollars. The relative strength line of gold stocks recently made a lower low (see red diamond), which indicates the interest of buyers is beginning to shift elsewhere.

From a money management perspective, we continue to give the bulls the benefit of the doubt and believe the S&P 500 could reach 1,400 to 1,440 in 2011. Some of our reasons for holding energy, materials, and industrial stocks were detailed on March 21. We also continue to favor mid caps relative to large cap stocks.
Rounding out the updated charts originally shown on March 10, both corporate bonds (LQD) and Malaysia (EWM) broke below their short-term rising relative strength lines, which is also indicative of a market that is favoring risk assets over defensive assets.


