4/27/2011 8:58:20 AM
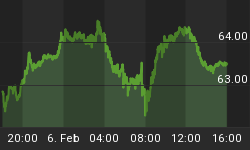
Buying programs were launched in anticipation of a benign FOMC statement on Wednesday...
Recommendation:
Take no aciton.
Click here to access our stock chat rooms today! For a limited time, try our chat room for free. No subscription necessary to give it a try.
Stock Market Trends:

- ETF Positions indicated as Green are Long ETF positions and those indicated as Red are short positions.
- The State of the stock market is used to determine how you should trade. A trending market can ignore support and resistance levels and maintain its direction longer than most traders think it will.
- The BIAS is used to determine how aggressive or defensive you should be with an ETF position. If the BIAS is Bullish but the stock market is in a Trading state, you might enter a short trade to take advantage of a reversal off of resistance. The BIAS tells you to exit that ETF trade on "weaker" signals than you might otherwise trade on as the stock market is predisposed to move in the direction of BIAS.
- At Risk is generally neutral represented by "-". When it is "Bullish" or "Bearish" it warns of a potential change in the BIAS.
- The Moving Averages are noted as they are important signposts used by the Chartists community in determining the relative health of the markets.
Best ETFs to buy now (current positions):
Short DIA at $124.63
Short SPY at $133.66
Short QQQ at $58.40
Click here to learn more about my services and for our best ETF portfolios.
Value Portfolio:
We hold no value positions at this time.
Daily Trading Action
The major index ETFs opened higher then moved lower for the first twenty minutes before reversing to head higher for the rest of the morning. The afternoon slide halted before 2:00pm and the bulls ran the major indexes higher yet again. The S&P-500 and NASDAQ-100 fell short of reaching the mid-day highs but the Dow was able to break out above its mid-day high briefly. The Dow and S&P-500 made new closing highs and the NASDAQ-100 was able to essentially reach its mid-February intraday high before double topping and falling back. The final forty-five minutes of trading saw weakness and the NASDAQ-100 closed up about one half of one percent. All three major indexes edged into uptrend states and have a BULLISH BIAS. The Semiconductor Index (SOX 450.48 +7.09) rose +1.6% as the bulls worked to ensure a comfortable jump up off of the 50-Day Moving Average (DMA). The Russell-2000 (IWM 85.18 +0.84) rose nearly one percent. The Regional Bank Index (KRE 26.49 +0.35) gained one and one third of one percent while the Bank Index (KBE 25.30 +0.20) was able to record a strong fractional gain. The Finance Sector ETF (XLF 16.18 +0.10) tacked on more than one half of one percent. The Regional Bank index and the Finance Sector ETF moved into trading states and the Regional Bank index has a NEUTRAL BIAS. The Regional Bank Index was also able to move up to an closing even with its 20- and 50-DMAs. Longer term Bonds (TLT 93.85 +0.90) essentially added one percent and looks ready to challenge its mid-March high. It shifted to an uptrend state and has a NEUTRAL BIAS. NYSE trading volume was below average with 904M shares traded. NASDAQ share volume was average with 2.074B shares traded.
There were two economic reports released:
- Case-Shiller 20-City Index (Feb) fell -3.3% versus an expected fall of -3.2%
- Consumer Confidence (Apr) came in at 65.4 versus an expected 64.4
The reports were released a half hour before and a half hour into the session respectively. Neither deviated much from expectations so weren't market moving.
The U.S. dollar fell another two tenths of one percent to close at a new two year low.
Implied volatility for the S&P-500 (VIX 15.62 -0.15) fell one percent while the implied volatility for the NASDAQ-100 (VXN 17.78 +0.56) rose more than three percent.
The yield for the 10-year note fell four basis points to close at 3.32. The price of the near term futures contract for a barrel of crude oil was flat closing down cents at $112.21.
All ten economic sectors of the S&P-500 moved higher led by Industrials (+1.8%).
Market internals were positive with advancers leading decliners 8:3 on the NYSE and by 7:4 on the NASDAQ. Up volume led down volume nearly 2:1 on the NYSE and by nearly 3:1 on the NASDAQ. The index put/call ratio rose 0.20 to close at 1.25. The equity put/call ratio was unchanged closing at 0.58.
Commentary:
Tuesday's trading was on below average volume on the NYSE and on average volume for the NASDAQ. We anticipate a one-two punch next. First, the Fed Open Market Committee (FOMC) will released their policy statement at 12:30pm. That will be followed by a Questions and Answers period held at 2:15pm by Fed Chairman Ben Bernanke. We don't anticipate a major change/mistake on the Fed's part, so this could be something of a let down for the market. However, we believe the market could run higher on the no news is good news premise. Thursday morning will see the GDP numbers released for the first quarter. In the past, worse than expected GDP numbers meant the Fed would extend quantitative easing but whatever actions the Fed is planning should have already been projected on Wednesday so we anticipate a potential for a bit of a sell-off in the markets.
We are battening down the hatches to ride out the squall until we can see movement get under way. With first quarter earnings reporting season nearing its end, the markets are likely to begin anticipating the end of quantitative easing (well, at least this stage of it) and the race for the exits could be brutal once it gets underway.
We hope you have enjoyed this edition of the McMillan portfolio. You may send comments to mark@stockbarometer.com.


