• 763 days Will The ECB Continue To Hike Rates?
  • 763 days Forbes: Aramco Remains Largest Company In The Middle East
  • 765 days Caltech Scientists Succesfully Beam Back Solar Power From Space
  • 1,164 days Could Crypto Overtake Traditional Investment?
  • 1,169 days Americans Still Quitting Jobs At Record Pace
  • 1,171 days FinTech Startups Tapping VC Money for ‘Immigrant Banking’
  • 1,174 days Is The Dollar Too Strong?
  • 1,175 days Big Tech Disappoints Investors on Earnings Calls
  • 1,175 days Fear And Celebration On Twitter as Musk Takes The Reins
  • 1,177 days China Is Quietly Trying To Distance Itself From Russia
  • 1,177 days Tech and Internet Giants’ Earnings In Focus After Netflix’s Stinker
  • 1,181 days Crypto Investors Won Big In 2021
  • 1,182 days The ‘Metaverse’ Economy Could be Worth $13 Trillion By 2030
  • 1,182 days Food Prices Are Skyrocketing As Putin’s War Persists
  • 1,185 days Pentagon Resignations Illustrate Our ‘Commercial’ Defense Dilemma
  • 1,185 days US Banks Shrug off Nearly $15 Billion In Russian Write-Offs
  • 1,188 days Cannabis Stocks in Holding Pattern Despite Positive Momentum
  • 1,189 days Is Musk A Bastion Of Free Speech Or Will His Absolutist Stance Backfire?
  • 1,189 days Two ETFs That Could Hedge Against Extreme Market Volatility
  • 1,191 days Are NFTs About To Take Over Gaming?
How The Ultra-Wealthy Are Using Art To Dodge Taxes

How The Ultra-Wealthy Are Using Art To Dodge Taxes

More freeports open around the…

Zombie Foreclosures On The Rise In The U.S.

Zombie Foreclosures On The Rise In The U.S.

During the quarter there were…

  1. Home
  2. Markets
  3. Other

The Technical Take: USO

The ups and down of the oil market are enough to give one a neck ache. Last week's drubbing saw an increase in volatility as 3 months of gains were erased in a couple of days. This week prices are going up and down in 4-5% increments per day. Yet, after all the gyrations, it appears that support levels are holding, and within the context of my crude oil model, this represents a low risk buying opportunity.

Figure 1 is a weekly chart of the US Oil Fund (symbol: USO). The support level I pointed out last week at 38.84 remains the "line in the sand". Just below that for a good measure of support is the rising 40 week moving average at 37.89. It appears that USO is trading around this support level, and despite all the volatility, we find USO is right back where it landed after last week's down draft.

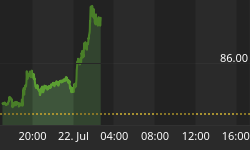
Figure 1. USO/ weekly
USO / weekly

I suspect this represents a good low risk entry at least from the stand point that if wrong you will know fairly quickly.


Back to homepage

Leave a comment

Leave a comment